
Death of Soft Landing
But it's provocative, gets the people going

Hello traders,
Hope you all had a great weekend and spent some time with your loved ones and got some time to relax and unwind.
The comforting narrative of a seamless economic deceleration known commomas the “soft landing” died this week.

It was not dismantled by a Trump Truthsocial post or a black swan event from abroad. It was dismantled by a moment of startling candor from the Federal Reserve itself.
In a revelation that will likely define the trading landscape for the entirety of 2026, Chair Jerome Powell conceded on Wednesday that the United States economy is no longer adding jobs. This admission serves as a gravitational singularity for global asset pricing. It suggests that the world’s largest economy is not merely cooling but may already be contracting in labor terms.
This reality has been masked only by the lagging nature of statistical modeling. Consequently, the risk paradigm has shifted violently from “inflation optimization” to “recession defense.” This shift was immediately visible in the bifurcation of asset classes. While the Dow Jones Industrial Average ground out record highs driven by defensive industrial positioning, the Nasdaq 100 succumbed to a sharp correction. The technology sector lost nearly 2% as the “AI Capex” narrative faced its first true crisis of confidence following disappointing guidance from Oracle and Broadcom.
The trading week concluding on December 12, 2025, will be recorded in financial history as a pivotal moment of regime change. As investors look toward the week of December 15, they face a “clearing event” of extraordinary magnitude. A backlog of critical data is scheduled for release in a condensed window due to prior government funding lapses. This includes the November Nonfarm Payrolls, Consumer Price Index, and Retail Sales. This “Data Super-Cycle” will force a reconciliation between the Fed’s grim internal labor estimates and the hard print of government statistics.
Algoflows Capital is a reader-supported publication. To receive new posts and support my work, consider becoming a free or paid subscriber.
Realtime Discord access with equity positions tracker, intraday orderflow & option dealer summaries included with the paid newsletter membership . Click here to subscribe.
The Monetary Pivot and the Labor Market Mirage
The decisions and communications emanating from the Federal Reserve during the week of December 8 to 12 have fundamentally altered the forward curve for interest rates. The central bank has effectively transitioned from a reactive stance against inflation to a proactive stance against labor market disintegration.
The December 10 Decision: Anatomy of a Fracture
The Federal Open Market Committee voted to lower the federal funds target rate by 25 basis points to a range of 3.50% to 3.75%. While the headline action aligned with consensus expectations, the internal dynamics of the committee reveal deep fractures regarding the path forward. The decision was not unanimous. It featured rare dissents from both sides of the ideological spectrum. This highlights the extreme uncertainty governing the current economic moment.
President Schmid of the Kansas City Fed dissented in favor of holding rates steady. He argued that inflation remains sticky above the 2% target. He believes the “last mile” of disinflation is being complicated by loose fiscal policy and looming tariffs. His concern focuses on the 3.0% to 3.1% headline CPI forecasts. He suggests that cutting rates into above-target inflation risks a resurgence reminiscent of the 1970s.
On the opposing flank, Chicago Fed President Goolsbee argued against “front-loading” cuts but expressed deep concern that real rates remain too restrictive given the deteriorating labor data. His commentary in subsequent interviews highlighted the risk of being “behind the curve” as the unemployment rate ticks higher. This divergence suggests the “Fed Put” is no longer a unified force. It is a contested policy tool that depends on data the Fed itself admits is flawed.
The ‘Negative Payroll’ Bombshell
The defining moment of the week occurred during Chair Powell’s press conference. In response to a question regarding the discrepancy between robust headline payroll numbers and the palpable weakness in the real economy, Powell stated a statistic that silenced the room.
“Payroll jobs are averaging 40,000 per month since April,” Powell said. “We think there’s an overstatement in these numbers by about 60,000. So that would be negative 20,000 per month.”
This admission confirms what bearish macro strategists have suspected for months. The Bureau of Labor Statistics’ “Birth-Death” model has broken down. This model imputes job creation from estimated business formations. In a high-rate environment with rising bankruptcies, the model likely continues to add phantom jobs from businesses that do not exist.
The implications for valuation models are profound. If the economy is shedding 20,000 jobs a month, aggregate demand must be contracting. This implies that current S&P 500 earnings-per-share estimates for 2026 are overstated. A contraction in the labor force correlates historically with a 10% to 15% decline in corporate earnings. A shrinking labor force implies a lower natural rate of interest, or r*. The Fed’s current policy rate of 3.50% to 3.75% is likely severely restrictive if the neutral rate has fallen to 2.5% or lower. This necessitates a more aggressive cutting cycle than the “gradual” pace currently priced by SOFR futures.
The Fog of War in Economic Data
The Fed is operating in what Powell described as a “foggy situation.” The lapse in government funding earlier in the year caused delays in critical data collection. This forced the Fed to rely on “plausible estimates” rather than hard data. This creates a dangerous feedback loop. The market relies on the Fed for guidance, but the Fed is flying blind. It relies on anecdotal evidence from the Beige Book and private sector data which often diverge from official statistics. This uncertainty premium must be priced into risk assets. It justifies the volatility seen in the VIX curve this week.
Part II: The Great Equity Rotation and the AI Reality Check

The equity market is no longer moving in unison. We are witnessing a violent rotation out of the “AI Hype” and into “Real Economy” value. This is driven by the realization that AI monetization may be further away than priced.
The Breakdown of the AI Trade
For twenty-four months, the market operated on the assumption that hyperscalers like Microsoft, Amazon, and Google would spend infinite capital on Nvidia chips regardless of immediate return on investment. The week of December 8 to 12 shattered this assumption.
Oracle shares plunged nearly 11% after missing revenue estimates. The company signaled that its massive AI capital expenditures would have a longer payback period. More alarmingly, reports surfaced that data center projects for OpenAI were being delayed to 2028. This news sent shockwaves through the semiconductor supply chain. Investors are moving from “Reward the Spenders” to “Punish the Spenders.” This “Capex Digestion” phase is typical of all technological revolutions. It suggests the Nasdaq 100 faces a structural headwind as multiples compress.
Broadcom, a bellwether for AI networking, beat earnings but issued guidance that failed to meet the “whisper numbers.” The stock dropped approximately 8%. The market’s reaction indicates that perfection is priced in. Any deviation from exponential growth is punished severely.
Divergence: Dow Jones vs. Nasdaq
The divergence between the indices tells the story of the rotation. The Dow Jones Industrial Average reached record highs, rising 1.2% for the week. The index is populated by companies that benefit from “Old Economy” dynamics. Financials benefit from a steepening yield curve. Industrials benefit from onshoring and tariff protectionism. Healthcare acts as a defensive rotation during economic slowing.
In contrast, the Nasdaq 100 fell 1.9% and signaled a bearish divergence. The rotation is capital flowing out of technology and into value. This is not a panic selloff but a reallocation of risk. Smart money is moving to sectors that can survive a recession (Utilities, Consumer Staples) or benefit from the new administration’s policies (Energy, Industrials).
The Oil Collapse and the Supply Glut

Crude Oil has decoupled from geopolitical risk. It is trading purely on a bearish supply and demand thesis. WTI settled at $57.44, down 2.13% for the week.
The Supply Glut Thesis
The primary driver is the International Energy Agency report forecasting a “record surplus” in 2026. Production from the US, Brazil, Guyana, and Canada is overwhelming global demand growth. The US is pumping at record efficiency. This renders OPEC+ cuts less effective. Global oil inventories have swollen to four-year highs.
OPEC+ discipline is fragile. With prices below fiscal breakevens for Saudi Arabia and Russia, the incentive to “cheat” on quotas is rising. A breakdown in OPEC+ discipline could trigger a price war similar to 2014. The “Negative Payrolls” narrative in the US combined with weak manufacturing PMIs in China and Europe paints a bleak demand picture. The market is pricing in a global manufacturing recession.
WTI is in a defined downtrend channel. Support at $56.80 is critical. A break below this level opens the path to $50. Resistance stands at $60.00. Gasoline prices have dropped to four-year lows providing a small stimulus to the US consumer but hurting refiner margins.
Geopolitics and the Energy Paradox

While monetary policy dominates the domestic narrative, the global geopolitical architecture is undergoing a stress test of significant magnitude. The interplay between kinetic conflict and economic warfare is creating distinct winners and losers in the commodities and currency markets.
The Middle East: Escalation and Apathy
The conflict between Israel and Iran has entered a new and more dangerous phase following the “June 2025 War” and subsequent skirmishes. Israel is reportedly preparing potential strikes on Iranian nuclear facilities if uranium enrichment crosses critical thresholds.
Despite the existential threat to the Strait of Hormuz, a chokepoint for 20% of the world’s oil supply, crude prices have collapsed. This reflects a profound “Recession Bias” among traders. The market is more afraid of demand destruction in China and the US than it is of supply disruption in the Gulf. This apathy creates a massive mispricing of volatility. A single successful strike on Iranian export terminals or the mining of the Strait would force a repricing of oil from $57 to over $80 overnight. The “Geopolitical Risk Premium” in oil is currently negative. This is an anomaly that historically resolves with a violent snapback.
Eastern Europe: The Fall of Pokrovsk
The war in Ukraine is shifting from a stalemate to a dynamic negotiation phase. Russian forces have captured the strategic city of Pokrovsk. Military analysts describe this as a “Pyrrhic victory” due to the loss of five divisions’ worth of armor and 25,000 troops. However, it has shifted the optical momentum in Moscow’s favor. This “inevitability” narrative is being leveraged by the Kremlin to force concessions.
President Zelensky’s meeting with leaders from the UK, France, and Germany in London to present a “revised peace plan” signals that Kyiv is preparing for a post-conflict reality. The prospect of peace is paradoxically bearish for oil. A ceasefire could lead to the reintegration of Russian crude into the formal market. This would remove the friction of the “shadow fleet” and increase transparent supply. Conversely, it is bullish for European equities like the DAX and CAC. These indices would benefit from lower energy volatility and reconstruction stimulus.
The Trade War and Tariffs
The second Trump administration has aggressively utilized executive power to reshape global trade flows. On February 1, 2025, Executive Orders were signed imposing tariffs on China, Mexico, and Canada. While the North American tariffs have been paused until March pending negotiations, the tariffs on China are set to bite.
The administration has invoked the International Emergency Economic Powers Act to impose “reciprocal tariffs” on countries not subject to other sanctions. This effectively creates a universal baseline tariff. The suspension of the “de minimis” exemption is a direct blow to platforms like Shein and Temu. It also impacts US consumers facing higher prices for low-cost goods. This is inflationary for the “goods” component of CPI. However, the exemption of Canadian energy from the full tariff rate has prevented a spike in US gasoline prices. This aids the disinflation narrative.
Treasury Markets and the Yield Curve
Despite the fiscal chaos and deficit concerns, the US Treasury market has shown remarkable resilience. The auction on December 9 was a resounding success. The high yield cleared at 4.175% with a bid-to-cover ratio of 2.55. This was stronger than the 6-month average of 2.51. The “tail” was 0.0 basis points. This indicates perfect pricing precision.
The 30-year bond auction also cleared well with a bid-to-cover of 2.43. Why is demand strong? First, at over 4.1%, the US 10-year offers a significant yield pickup over German Bunds or Japanese JGBs. Second, in a world of geopolitical instability and negative payrolls, the US Treasury remains the ultimate collateral. Third, the easing cycle lowers the financing cost for leveraged holders of Treasuries.
The yield curve is steepening. As the Fed cuts the front end to save the labor market, the long end remains sticky due to inflation and tariff fears. This “bull steepening” is a classic late-cycle recession signal. The 2-year yield is anchored by rate cuts, but the 10-year yield reflects the long-term fiscal reality.
Digital Assets and the $100k Ceiling
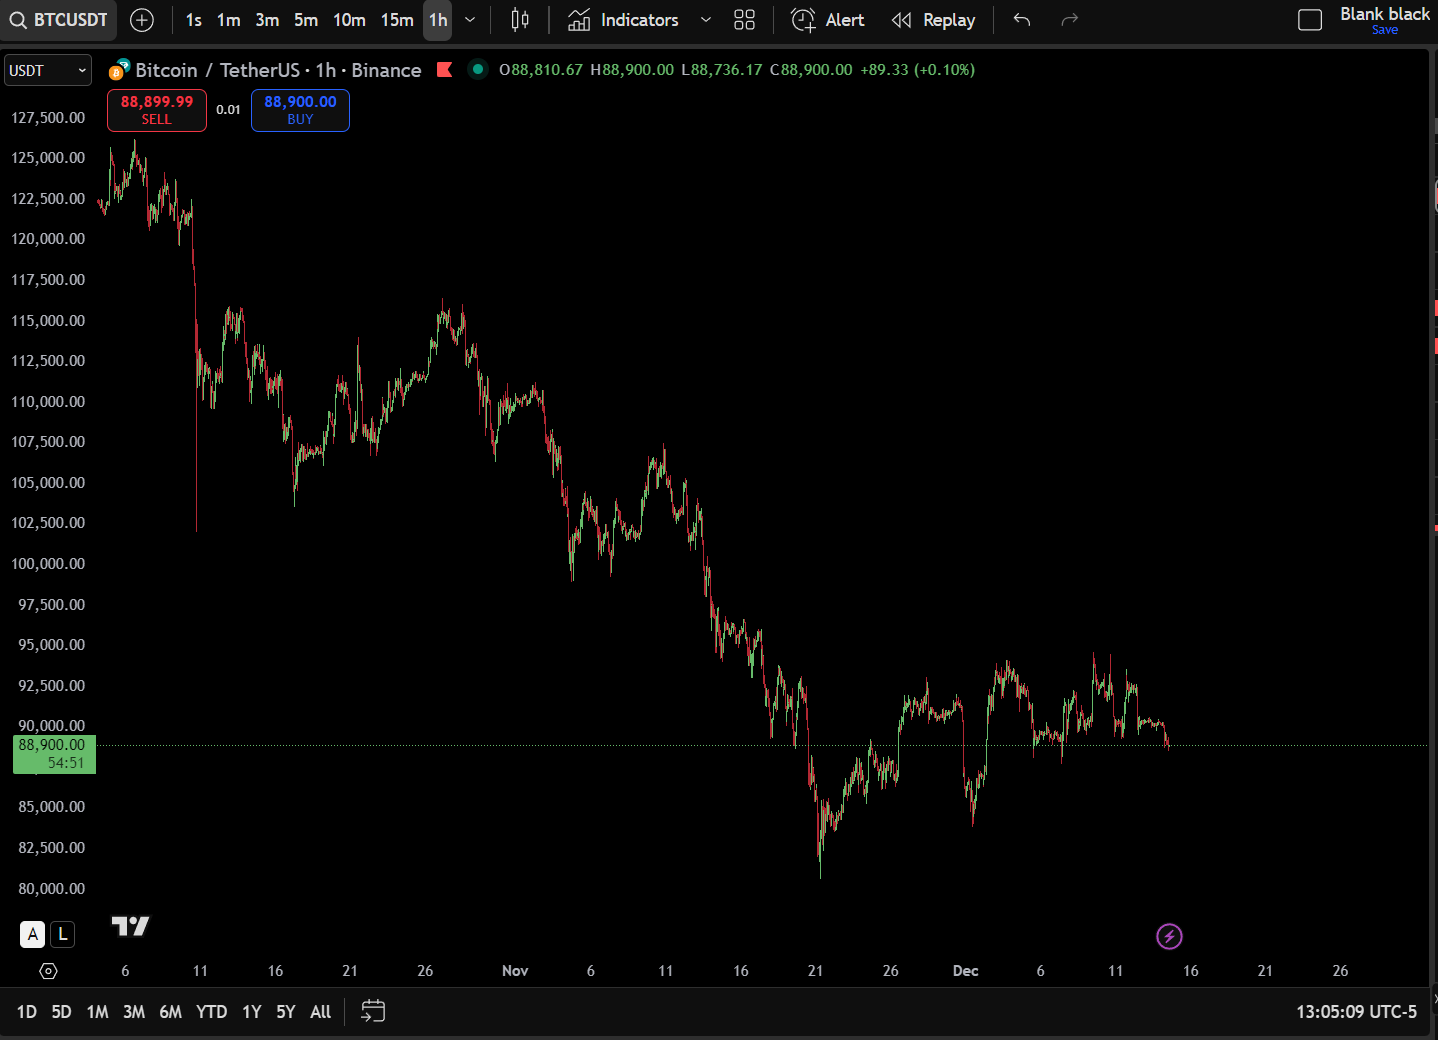
Bitcoin has failed to capitalize on the “Fed Pivot” liquidity injection. It is behaving more like a high-beta tech stock than digital gold. BTC closed the week around $90,218, down 1.74%.
Bitcoin is currently highly correlated with the Nasdaq. As the “AI Trade” unwinds, liquidity is also being pulled from crypto. The “risk-off” sentiment in equities is overpowering the “monetary debasement” thesis that usually supports crypto. The 2x Bitcoin Strategy ETF (BITX) declared a dividend, signaling the maturation of the asset class’s financial infrastructure. However, spot volumes have cooled.
Technically, the $98,000 to $102,000 zone remains a formidable “psychological wall.” The 52-week moving average at $102,200 is the key level to watch for a breakout. Immediate support lies at $85,929. A breakdown below the $83,712 pivot would invalidate the bullish trend and likely trigger a liquidation cascade to $78,000. Bitcoin needs a specific catalyst to break $100k. This would likely be a resurgence of banking sector stress or a clearer liquidity injection signal from the Fed.
The Week Ahead and Trading ideas
S&P 500 Analysis
