
Weekly Market Outlook 09/01/2025
Growth vs Inflation

Hello traders,
I hope you had a great long weekend and enjoyed some time off from the screens.
You can jump to the Weekly levels by clicking on them directly.
AUDIO SUMMARY OF THIS ARTICLE HERE
This past week, President Trump decided to fire Fed’s Lisa Cook over mortgage fraud allegations.

Defiant Lisa Cook has decided to stay on and work at the Fed

This newsletter has not taken any political sides thusfar as that is not our field of expertise. However, threatening the independence of the Fed is something not a democracy should tolerate.
Trump says he’ll have a Fed ‘majority’ soon to push rates lower after firing Cook
This essentially means that the administration wants to focus on growth and employment over inflation risks.
In the coming weeks, we would provide a deep dive as to how this policy stance can affect equities and rates for Q4 and beyond.
AlgoFlows’s Newsletter is a reader-supported publication. To receive new posts and support my work, consider becoming a free or paid subscriber.
Realtime Discord access with intraday orderflow & option dealer summaries included with the paid newsletter membership . Click here to subscribe.
The Fed's Dilemma: Navigating Data, Politics, and Inflation
Deconstructing the Dovish Tilt

The Federal Reserve has clearly signaled a dovish pivot. Fed Chair Jerome Powell's Jackson Hole speech and the July FOMC minutes revealed a committee increasingly concerned about downside risks to the labor market, paving the way for a potential rate cut. This concern was amplified by an exceptionally weak July jobs report, which showed only 73,000 jobs added and significant downward revisions to prior months. In its official statement, the Fed downgraded its assessment of economic growth from "a solid pace" to "moderate".
However, this dovish narrative is contradicted by a swath of other data. Second-quarter GDP growth was revised up to a robust 3.3%. Financial conditions have actually eased since April, and corporate credit spreads are at 18-year lows, indicating a lack of financial stress. Furthermore, core PCE inflation, the Fed's preferred gauge, remains elevated at 2.9%, with the full inflationary impact of new tariffs yet to be felt. The internal debate at the Fed is also heating up; the July FOMC meeting saw two dissenters, Governors Bowman and Waller, who favored an immediate rate cut, highlighting a growing split within the committee.
With market pricing indicating an approximately 88% probability of a rate cut in September, the Fed's justification rests almost exclusively on the softening labor market. This selective focus, while ignoring resilient growth and sticky inflation, strongly suggests that intense political pressure from the Trump administration is a significant, if unstated, factor in its calculus. This positions the upcoming jobs report as a test of the Fed's independence. A strong report would create a binary choice: cut rates and confirm political capitulation, or hold rates and trigger a market tantrum based on a now-dashed expectation. The Fed's "data dependency" appears to be morphing into "political dependency," a dangerous shift for market stability that transforms Friday's report from a mere economic data point into a political litmus test that will force the Fed to reveal its true reaction function, creating a major volatility event.
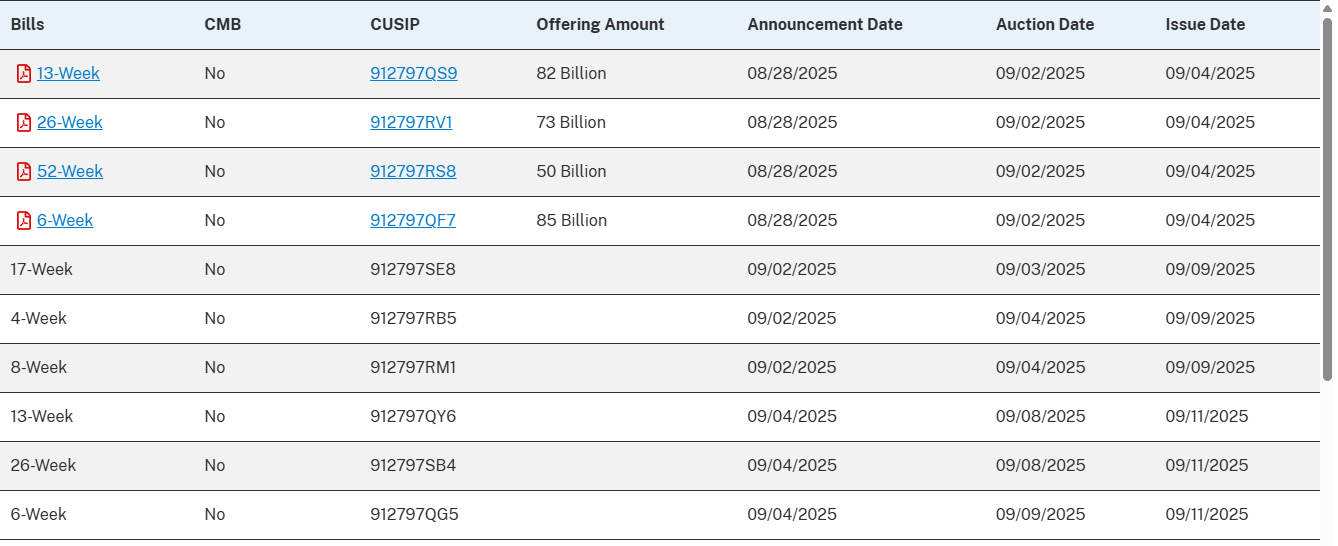
Bond Market Barometer
The U.S. Treasury market is reflecting this complex outlook. The 10-year Treasury yield ended last week around 4.23%, with the spread between the 2-year and 10-year yields steepening to 61 basis points. This steepening can be interpreted in multiple ways: it could reflect expectations of future growth and inflation, or it could signal that investors are demanding higher compensation for holding long-term debt amidst rising government issuance.
The upcoming week features several large Treasury bill auctions, which will provide a real-time gauge of demand for short-term government debt. The results of these auctions, particularly the bid-to-cover ratios, will be closely watched for signs of stress or stability in funding markets as the Fed contemplates an easing cycle.
Equity Indices (ES & NQ): The NFP Gauntlet
U.S. equity indices are navigating a treacherous path, caught in a tug-of-war between the bullish allure of potential Federal Reserve rate cuts and the bearish realities of a slowing economy and stubbornly high inflation. The technology-heavy Nasdaq-100 (NQ) is particularly exposed in this environment. Due to the long-duration nature of the growth stocks that dominate the index, its valuation is acutely sensitive to changes in long-term interest rates. A hawkish surprise from the Fed, or a spike in bond yields driven by poor demand at Treasury auctions, would therefore be expected to have a disproportionately negative impact on NQ relative to the broader market.
Analysis (ES - E-mini S&P 500)
Current State: The E-mini S&P 500 September futures contract (ESU25) closed the prior week at 6474, consolidating within a range after a failed attempt to break out above 6523. The broader picture remains constructive, with the index continuing to trade within a well-defined rising trend and positioning has been largely bullish per the COT report.
Key Support Levels: Immediate support is found near 6453. A more significant zone of support exists at the 6400 psychological level, which also corresponds to a prior resistance area. The most critical short-term support to watch is the 6360/50 zone; a break below this level would signal a more serious deterioration in market structure.
Key Resistance Levels: The primary resistance barrier is the consolidation high in the 6489-6495 area. A decisive break above this level would open the door to a retest of the recent high at 6523. Beyond that, a potential upside target resides near the 6600 level.
Outlook: The technical posture is cautiously bullish but highly vulnerable to a reversal driven by a hawkish fundamental catalyst. The integrity of the 6350 support level is paramount for maintaining the current bullish structure.
Analysis (NQ - E-mini Nasdaq-100)
Current State: The E-mini Nasdaq-100 September futures contract (NQU25) closed the prior week around 23,415, showing signs of relative weakness compared to the S&P 500.
Key Support Levels: Immediate support lies near the recent low of 23,320. A break of this level would expose a significant air pocket down to the next major medium-term support zone, located around 22,200.
Key Resistance Levels: The primary upside obstacle is the all-time high near 24,068.
Outlook: While the long-term trend remains positive, the medium-term chart is flashing a significant warning sign in the form of a market that is undergoing a critical sentiment shift. The period of indiscriminately buying any stock associated with artificial intelligence appears to be over. The negative reactions from Dell and Marvell reveal a new market calculus: the astronomical capital expenditures required for AI are pressuring margins for downstream players and hardware providers. The market is now being forced to differentiate between the primary beneficiaries of the AI buildout (like Nvidia) and the rest of the ecosystem. This week's earnings from Broadcom will be a crucial test of this evolving and more discerning narrative.
Trade Ideas & Scenarios
Scenario 1 (Hot NFP: Payrolls > 150k, Wages > 0.4% MoM): This outcome would severely undermine the case for a September rate cut, likely sending bond yields higher.
Trade Idea: Short NQ futures on a confirmed break of initial support. The thesis is that higher yields will compress the valuations of growth-oriented tech stocks, leading to NQ underperformance.
Entry: Sell on a 1-hour close below 23,300.
Target: 22,500.
Stop: A 1-hour close back above the post-data high.
Scenario 2 (Cold NFP: Payrolls < 80k, Unemployment Rate Rises): This outcome would all but guarantee a September rate cut, fueling a dovish policy rally.
Trade Idea: Buy ES futures on a breakout above the recent consolidation range. The thesis is that confirmation of Fed easing will trigger a broad market rally, lifting the more diversified S&P 500.
Entry: Buy on a 1-hour close above 6495.
Target: 6550.
Stop: A 1-hour close back below the post-data low.
Geopolitical Risk Monitor: Shifting Alliances and Middle East Tensions
A. The New Eastern Axis: SCO Summit and Global Trade Realignment

While macroeconomic data will dominate short-term price action, a profound structural shift in the geopolitical landscape continues to unfold, with long-term implications for global markets. The ongoing Shanghai Cooperation Organisation (SCO) summit in Tianjin, China, serves as a powerful symbol of this realignment, bringing together the leaders of China, Russia, and India, among other Eurasian states.
The war in Ukraine has acted as a powerful catalyst, accelerating a bifurcation of the global economy into two distinct blocs. On one side, the G7 nations have imposed sweeping sanctions on Russia, causing their exports to the country to collapse. On the other, a new economic axis has solidified. Chinese exports to Russia have surged, with shipments of transportation equipment, for example, rising by nearly 500% since the conflict began. India, meanwhile, has transformed its energy import strategy, becoming a primary destination for Russian crude oil, which is increasingly being transacted outside of the U.S. dollar-denominated system.
This development represents more than a temporary rerouting of trade; it is the tangible formation of a powerful Eurasian economic bloc that is actively building financial and trade infrastructure to operate independently of the Western-led system. The long-term consequences are significant, posing a structural challenge to the U.S. dollar's decades-long hegemony as the world's primary reserve currency. For commodity markets, this shift will continue to redraw the map of global flows, impacting supply chains for everything from crude oil to agricultural products like wheat and corn.
B. The Middle East Powder Keg: Iran-Israel Conflict and Sanctions Snapback
The most acute and immediate geopolitical risk to markets stems from the Middle East, where the long-simmering shadow war between Iran and Israel has escalated into a more direct and dangerous phase. The conflict entered a critical new chapter in June 2025 with a series of Israeli airstrikes targeting Iranian nuclear and military sites, which was met with retaliatory missile strikes from Iran. The tit-for-tat exchanges have continued, with recent events including alleged Israeli airstrikes that killed senior Houthi-backed officials in Yemen's capital, Sanaa, and a chilling Iranian intelligence operation that leaked the personal data of Israeli drone operators and their families.
This military escalation is occurring in parallel with a major diplomatic confrontation. In response to Iran's continued nuclear advancements and its decision to halt all cooperation with the International Atomic Energy Agency (IAEA) following the June attacks, the three European signatories to the 2015 nuclear deal (the E3: United Kingdom, France, and Germany) have formally triggered the "snapback" mechanism. This process, which is veto-proof at the UN Security Council, is set to reimpose a wide array of international sanctions on Tehran.
Predictably, this move has been met with staunch opposition from the opposing geopolitical bloc. Russia and China have formally joined Iran in a joint statement rejecting the legal and procedural basis of the snapback, further cementing the global diplomatic divide and leaving little room for a negotiated off-ramp.
The primary market impact of this escalating crisis is concentrated in the global energy markets. The fundamental supply-and-demand picture for crude oil has recently turned bearish. OPEC+ has been steadily increasing production, completing the return of 2.2 million barrels per day (bpd) of supply that was previously withheld. Simultaneously, peak seasonal demand in the United States is waning with the end of the summer driving season. Reflecting these dynamics, the U.S. Energy Information Administration (EIA) recently made a sharp downward revision to its fourth-quarter price forecast for Brent crude, cutting it from $71 to $58 per barrel.
In a normal market environment, these factors would exert significant downward pressure on prices. Yet, West Texas Intermediate (WTI) crude has not collapsed; instead, it has been consolidating in a resilient manner around the $64 per barrel level. The key variable supporting the market is the substantial geopolitical risk premium associated with the Iran-Israel conflict. Traders are unwilling to aggressively press short positions, despite the bearish supply data, because the risk of a sudden, sharp price spike on a new military or political headline is exceptionally high. A direct conflict could threaten the 17 million bpd of oil that transits the Strait of Hormuz, a critical global chokepoint. This dynamic has effectively created a "geopolitical put option" under the market, establishing a floor and preventing a significant price decline. This explains the current price consolidation and sets the stage for a highly volatile reaction to any change in the geopolitical temperature: a de-escalation could trigger a rapid drop in prices as the risk premium evaporates, while any new provocation could lead to a sharp rally.
What does this mean for crude oil Algo
Ah, Thanks for asking!
Crude Oil (WTI): OPEC Supply vs. Geopolitical Premium
The crude oil market remains locked in a state of fundamental conflict. The bearish weight of increasing OPEC+ supply and the seasonal decline in U.S. demand is being directly counteracted by the bullish support of a significant geopolitical risk premium tied to the Iran-Israel conflict. Adding a critical layer to this dynamic is the market's internal positioning. The latest Commitment of Traders (COT) report reveals that speculative traders (classified as non-commercials) hold an extremely large net short position, at a level that falls in the 97th percentile over the last five years. This crowded bearish positioning creates a combustible environment, ripe for a violent short-squeeze rally should a bullish catalyst emerge and force these traders to rapidly buy back their positions.
Analysis (WTI Futures)
Current State: WTI crude oil futures (CL) are trading near $64.13 per barrel, coiling on the 4-hour chart. This consolidation pattern is a visual representation of the market's deep indecision and balance between buyers and sellers.
Key Support Levels: initial support around $63.66. This level is critically important as it also corresponds to a key quarterly pivot point identified at $63.63. A break below this confluence of support would target lower levels at $62.96 and $62.24.
Key Resistance Levels: On the upside, initial resistance is found at the $64.65. A breakout above this level would target further resistance at $66.46.
Outlook: The technical outlook is neutral, pending a resolution from the current consolidation. The narrowing of the price range suggests that a significant expansion in volatility is imminent.
Trade Ideas & Scenarios
Trade Idea 1 (Bullish Breakout / Short Squeeze): A sustained close above upper boundary at $65.12 would confirm a bullish breakout and could act as the trigger for a short squeeze, given the extreme speculative short positioning.
Entry: Buy on a 4-hour close above $65.20.
Target: A primary target of $66.46, with a secondary target near $68.00.
Stop: A 4-hour close back below $64.50.
Trade Idea 2 (Bearish Breakdown): A close below the critical support confluence around the $63.63 quarterly pivot would signal that the bearish supply dynamics are finally overwhelming the geopolitical risk premium.
Entry: Sell on a 4-hour close below $63.50.
Target: $62.24.
Stop: A 4-hour close back above $64.20.
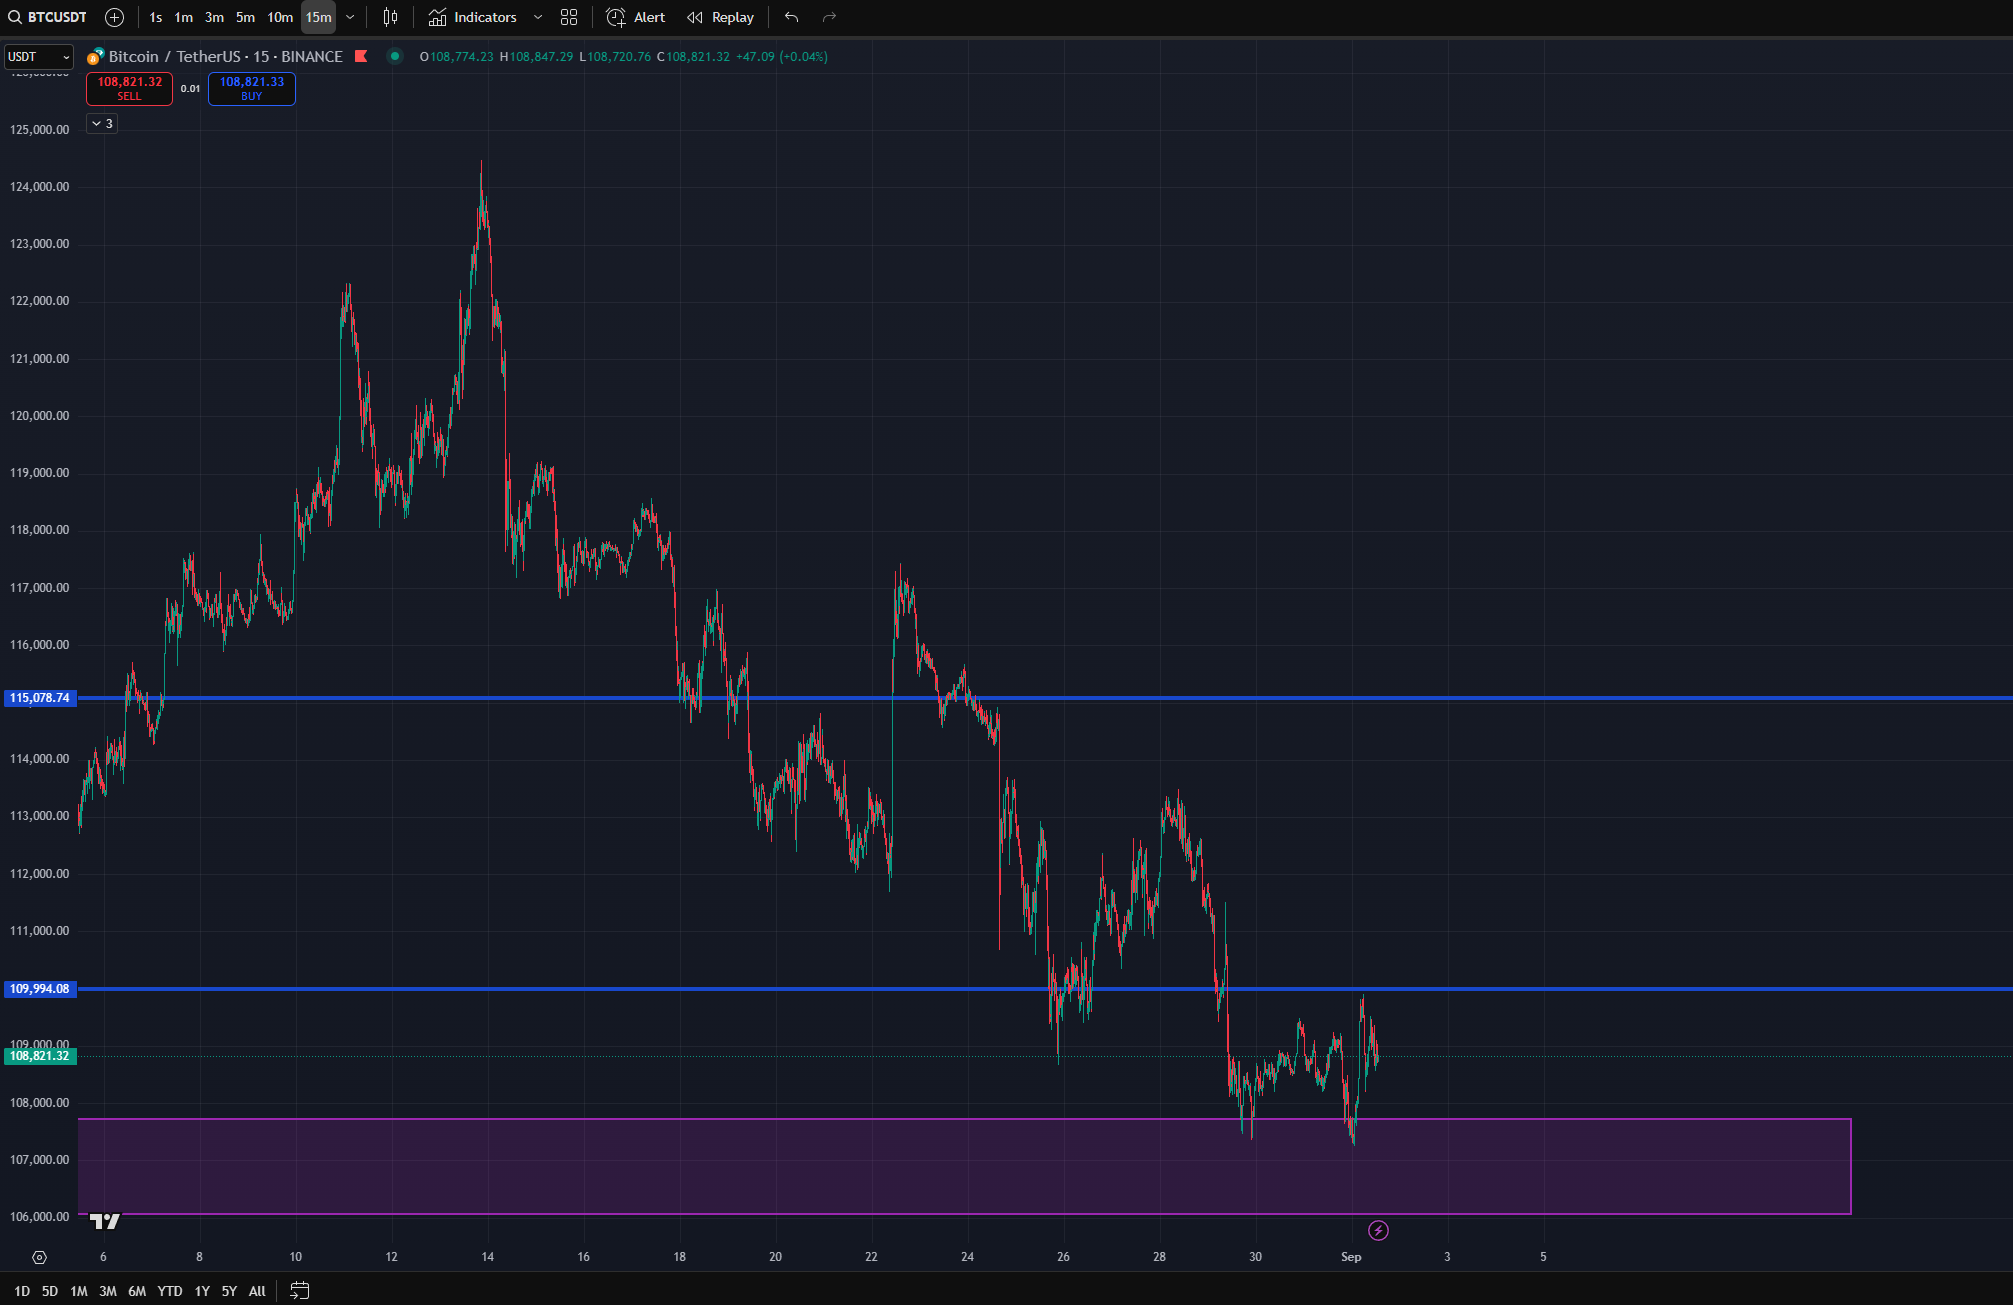
Bitcoin (BTC): A Critical Test of Support
Bitcoin continues to trade as a macro-sensitive risk asset, with its price action heavily influenced by shifts in global liquidity conditions and expectations for central bank policy. A confirmed dovish pivot from the Federal Reserve, leading to lower interest rates and increased liquidity, would provide a supportive tailwind for the digital asset. Conversely, a "higher for longer" interest rate environment or a significant risk-off event in traditional markets would act as a major headwind.
Technical Analysis (BTC/USD)
Current State: Bitcoin is exhibiting weak short-term technical development. The price is trending lower and closed the previous session near $107,657. Short-term momentum is strongly negative. While this signals a deeply oversold condition that could precede a relief bounce, it also serves to confirm the strength of the current downtrend.
Key Support Levels: The price is currently testing a critical confluence of medium-term support in the zone between $106,000 and $107,710. This area represents a crucial battleground between short-term bears and long-term bulls. A confirmed breakdown below $106,000 would be a significant negative technical development.
Key Resistance Levels: On any bounce, initial resistance can be expected at the psychological $110,000 level, followed by the top of the recent range near $115,500.
Outlook: The technical picture is characterized by a conflict between timeframes. The short-term trend is definitively negative. However, this downtrend is now testing a major medium-to-long-term support level, where the broader uptrend could potentially resume. The market's reaction at this support zone will be pivotal for determining the next major directional move.
Trade Ideas & Scenarios
Trade Idea 1 (Bullish Reversal from Support): For traders with a higher risk tolerance, a long position could be initiated if the price demonstrates a clear defense of the current support zone, coupled with a bullish reversal signal.
Entry: Await the daily close within the $106,000-$107,710 support zone.
Target: A move back toward the range high at $115,000.
Stop: A daily close below $105,500.
Trade Idea 2 (Bearish Breakdown): A more conservative strategy involves waiting for a confirmed failure of the support level before initiating a short position.
Entry: Sell on a daily close below $106,000.
Target: The next major psychological and technical support zone around $98,000-$100,000.
Stop: A daily close back above $108,000.
Concluding Remarks and Weekly Levels
The week ahead is set to be a defining one for markets, with the culmination of economic data forcing a resolution to the prevailing tension between dovish rate cut expectations and the hawkish reality of persistent inflation. Friday's Non-Farm Payrolls report stands as the singular, pivotal catalyst that will likely dictate the Federal Reserve's policy path and, by extension, the direction of global asset prices in the near term. The highest-conviction outlook for the week is not directional, but rather for a significant expansion in volatility across all asset classes as the market is forced to digest and reprice based on the NFP outcome.
The geopolitical landscape provides a complex and volatile backdrop. The solidification of a Russia-China-led economic bloc signals a long-term structural challenge to the existing world order, while the acute risk of a broader conflict between Iran and Israel continues to place a firm floor under crude oil prices, defying otherwise bearish supply fundamentals.
For market participants, vigilance and adaptability will be paramount. The key levels to monitor are clear: in the S&P 500, the 6350 support level is the critical line of defense for the bullish trend. In the Nasdaq-100, relative underperformance against the S&P 500 will be a key tell for risk appetite. For WTI crude oil, the resolution of the consolidation range between $63.63 and $65.12 will likely initiate the next major directional leg. Finally, for Bitcoin, the defense of the $106,000 support level is essential to prevent a deeper technical breakdown. The market has reached its inflection point; the data will now render its verdict.
Weekly Levels
Subscribers are urged to use the tradingview indicator to plot the levels.
NOTE: SUBSCRIBERS ARE URGED TO JOIN THE DISCORD AT THEIR EARLIEST CONVENIENCE.
