
Weekly Market Outlook 11/09/2025
Open The Government

Hello traders,
I hope you had a great weekend and are well rested to take the market head-on this week.
Realtime Discord access with equity positions tracker, intraday orderflow & option dealer summaries included with the paid newsletter membership . Click here to subscribe.
I. The Liquidity Collision
The market enters the second week of November caught in the crossfire of a powerful and contradictory “Liquidity Collision.” This conflict, between a severe present-day liquidity strain and a massive, anticipated liquidity wave, is the central framework for understanding all cross-asset price action. The market is not currently trading on economic fundamentals; it is trading on liquidity plumbing.
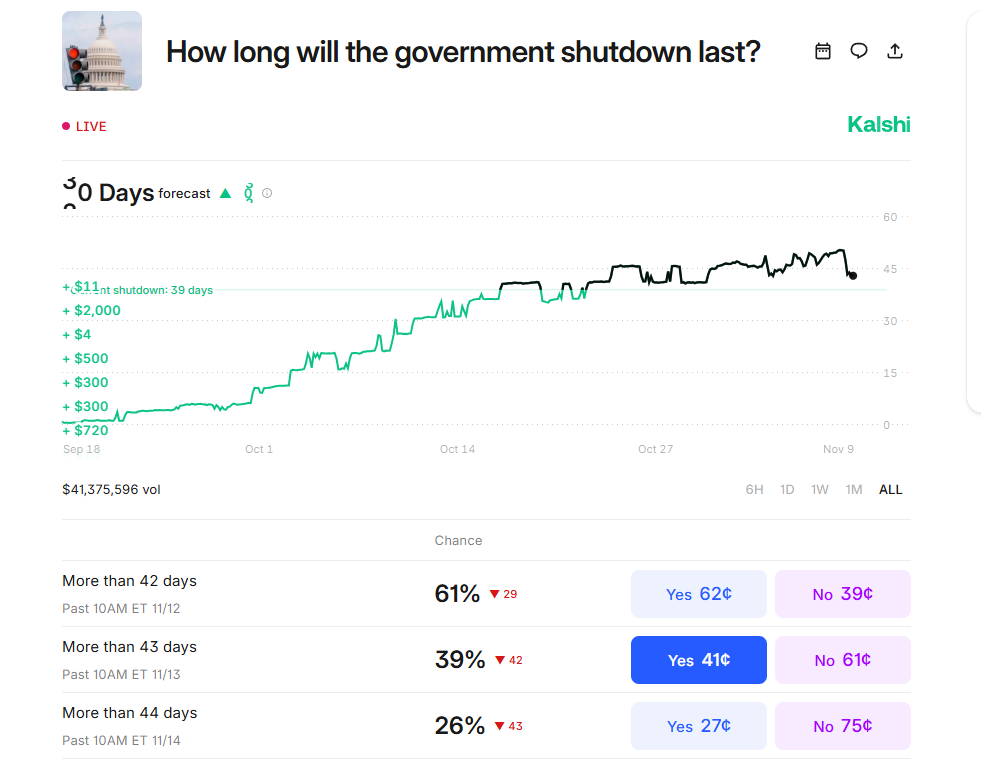
The present strain is an acute “liquidity tantrum” triggered by the U.S. government shutdown, which has now set a new record for the longest in history. This is no longer a political abstraction; its “material effects on the economy” are now being felt, acting as a significant “weight on the indices”. This has mechanically drained liquidity from the system, forcing a “momentum / crowd long unwind” and a flight-to-safety bid in the U.S. Dollar, which was effectively the only asset positive on the week.
The future wave is a powerful, two-part liquidity injection that the market is beginning to “front-run”.
The TGA Drawdown: The eventual government reopening will unleash “hundreds of billions of dollars back into the financial system” as the Treasury General Account (TGA) is rapidly drawn down to fund weeks of frozen payments. This functions as a temporary, but massive, quantitative easing.
The End of QT: The Federal Reserve’s scheduled end of Quantitative Tightening on December 1st. This dovish pivot, which formally concludes the Fed’s balance sheet reduction, removes a structural headwind and provides a significant tailwind for risk assets heading into year-end.
This ‘future wave’ is no longer a distant forecast. As of Sunday evening (November 9), news broke that a bipartisan deal to end the government shutdown is ‘within reach’ . According to reports, at least 10 Senate Democrats are prepared to support a procedural vote, in exchange for a future vote on ACA tax credits . This development is the primary bullish catalyst for the week, signaling the ‘present strain’ is collapsing and the ‘future wave’ of liquidity is imminent. Stock index futures (ES and NQ) reacted positively to the news, indicating the market is already pricing in this resolution .
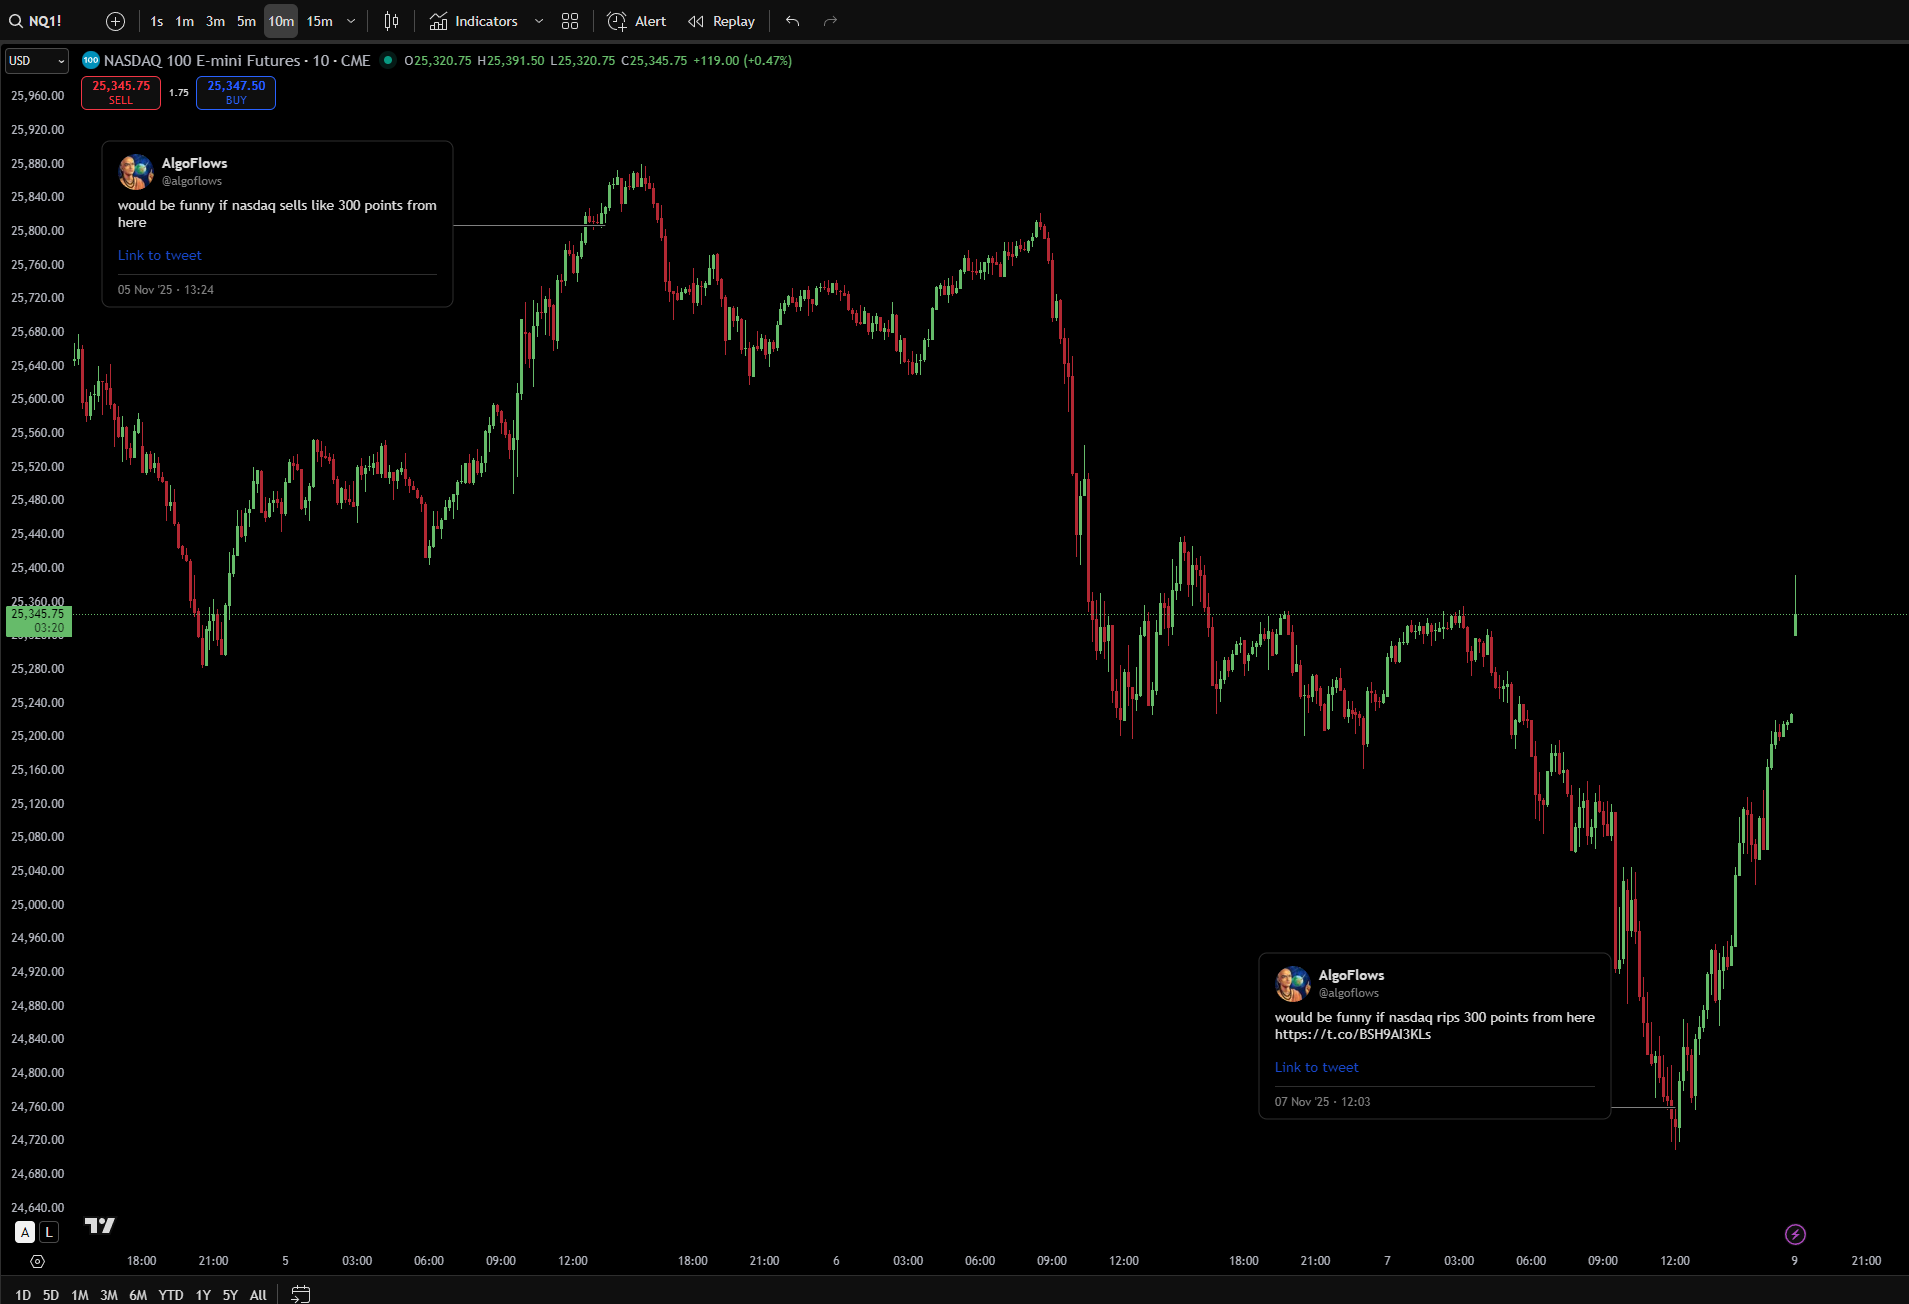
This “Liquidity Collision” framework is the only way to explain the prior week’s “contradictory” price action. The tech-heavy, high-momentum Nasdaq 100 (QQQ) was the worst-performing index, closing lower by over 340 basis points, while the defensive, industrial-heavy Dow (DIA) was the “best” performer, declining only 140 basis points. This is a classic symptom of a liquidity-driven risk-off unwind, where high-beta “momentum” is sold first, and capital hides in “safety.”
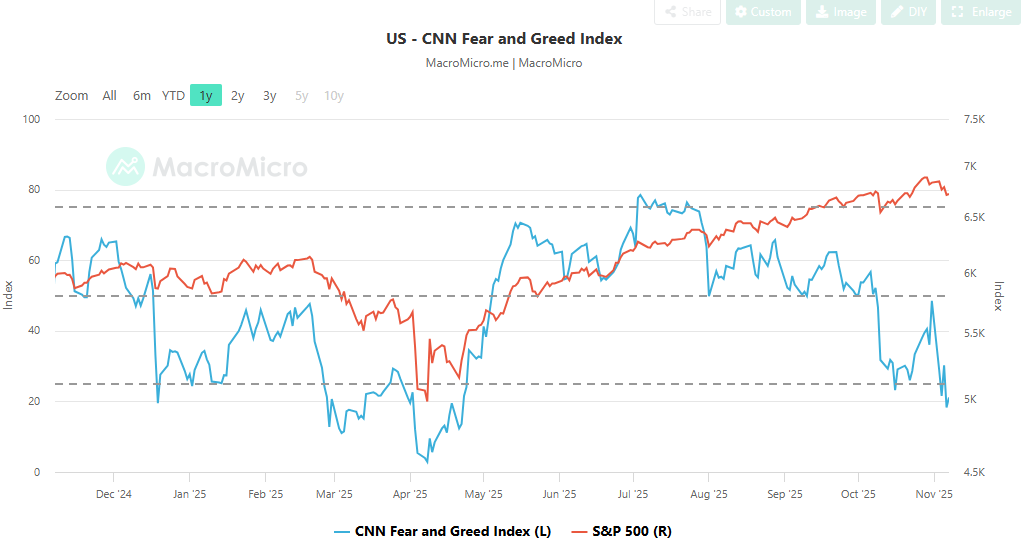
Furthermore, this framework explains the market’s greatest apparent paradox: the Fear/Greed Index is flashing “Extreme Fear” (a reading of 21) while the S&P 500 sits just 3% from its all-time highs. This is the hallmark of a deeply unhealthy, narrow, and liquidity-starved rally. The market’s internals are collapsing while a handful of mega-cap names, acting as liquidity havens, hold the index aloft.
The week ahead (w/c Nov 10) represents a breaking point for this thesis. The present strain will be tested by a massive $125 billion Treasury auction in a holiday-shortened week.. The future wave will be tested by political headlines on the shutdown. In the “data fog” created by the shutdown; which has halted the collection of reliable economic statistics; these liquidity-plumbing and policy events will supersede all else.
The “news failure” in the U.S. Dollar last week confirms this. The Dollar fell despite stronger-than-expected ADP and ISM data. This proves the market is no longer trading on macro fundamentals. It is trading on liquidity dynamics, and the “future wave” of liquidity is beginning to overwhelm the “present strain.”
Take advantage of APEX’s 70% promo code and pass account in one day. Also Use code ALGO or alternatively just click the button below
I’m also giving away any size Apex accounts for free for 3 random people who like and restack this post . Contest ends this Friday.
II. Market Internals: Deconstructing the “Extreme Fear”
The index level is masking a severe deterioration in market health. While the S&P 500 remains just 270 basis points off its all-time high , the market has flocked to the perceived safety of the Mag-7, leaving the “S&P 493” (the other 493 stocks in the index) deeply oversold.
The Collapsing Breadth
A review of market internals reveals a grim picture:
Percent of Stocks > 20-Day MA: This short-term breadth metric sits at just 38.5%. A reading below 40% is considered “oversold territory,” a condition that has persisted even as the index has remained elevated.
Percent of Stocks > 50-Day MA: This medium-term metric is even more alarming, sitting at a mere 37.9%. This reading is lower than it was during the “Trump tariff threat” a few weeks prior, a threat that caused a 300-basis-point intraday decline. The S&P 500 is now 200 handles higher than that low, yet its underlying metrics are even more oversold.
The “Extreme Fear” Signal
This collapse in breadth is the primary driver of the “Extreme Fear” reading on the Fear/Greed Index, which closed the week at 21. The market is bifurcated: a small handful of mega-caps are exhibiting “Greed,” while the vast majority of stocks are in a state of “Extreme Fear”.
This signal should not be dismissed. A historical analysis of the Fear/Greed Index shows that every instance of a reading in “Extreme Fear” territory over the last few years has “marked every major & interim low”. This suggests the current state of fear is not a reason to sell, but rather a powerful contrarian “buy” signal, indicating that the internal, liquidity-driven correction may be complete.
Positioning: The Missing Chase
This “buy” signal is amplified by investor positioning, which shows a complete lack of “FOMO” or “chase.”
Consolidated Equity Positioning: Sits at just the 53rd percentile, a neutral reading.
Discretionary Investor Positioning: These key market participants are actively underweight, at just the 35th percentile.
There is “continued upside complacency”. This lack of participation, combined with “Extreme Fear” and deeply oversold internals, creates a classic “wall of worry”. There is significant cash on the sidelines, providing ample fuel for a year-end rally should the liquidity picture reverse.
This unstable condition: a high index level with low participation and extreme fear: cannot persist. It will resolve in one of two ways: either the Mag-7 “catches down” to the internals (the bear case), or the internals bottom and a “healthier rotation-driven advance” begins. Late-week action, which saw small-caps (IWM) begin to outperform the Nasdaq (QQQ), suggests this latter rotation may have already begun.
III. The Bifurcated Macro Landscape: A Tale of Two Economies
The economic data from the prior week was deeply contradictory, painting a bifurcated picture of the U.S. economy that has confused many market participants.
The “Strong” Economy (Services & Labor)
On one hand, backward-looking and contemporaneous data showed surprising resilience:
ADP: The private payroll report came in “stronger than expected,” showing a gain of 42,000 jobs versus expectations of 30,000.
ISM Services: The services sector, the heart of the U.S. economy, showed a “solid rebound” to 52.4 (up from 50.0 and beating the 50.8 expectation). The internal components were particularly strong, with the New Orders Index jumping from 50.4 to 56.2, reflecting robust demand.
The “Weak” Economy (Consumers & Labor Fear)
On the other hand, forward-looking data points painted a “less rosy” picture of deep and growing pessimism:
UMich Consumer Sentiment: This report was a “less rosy” datapoint, falling to 50.3, its second-lowest reading on record. This is a shocking figure, weaker than the sentiment recorded during the 2008 Financial Crisis or the 2020 pandemic lockdown.
Challenger Job Cuts: This was another “less rosy” report, detailing real pain in the labor market. Retail layoffs are up 145% year-to-date, while technology firms have announced 141,000 job cuts this year, driven by AI-related restructuring.
The Fed’s “Tell” - The Unemployment Proxy
In this “confusing” environment, the market must identify the single data point the Federal Reserve will prioritize. That data point was released last week: the Unemployment Rate proxy was revised up to a new cycle high of 4.36%.
")
This is the “tell.” This structural signal of labor market deterioration is “exactly what the Fed fears”. Fed Chair Powell has been explicit that “further deterioration within the labor market remains unwanted”. This 4.36% reading, a new cycle high, gives the Fed the definitive “all-clear” to maintain its dovish pivot (ending QT) and prepare for rate cuts, regardless of the high-frequency “noise” from the ADP or ISM reports. This data point overrides the “strong” economic data and solidifies the “future liquidity wave” thesis.
IV. The Week Ahead (Nov 10-14): The $125B Test & The CPI “Ghost Report”
The market’s primary driver for the week of November 10 will not be macro data, but political headlines and liquidity-plumbing events.
