
Weekly Market Outlook 11/16/2025

Executive Summary

The penultimate full trading week of November 2025 arrives with markets at a critical inflection point, characterized by pronounced factor rotation dynamics, evaporating Fed policy clarity, and escalating geopolitical crosscurrents that collectively create an exceptionally complex trading environment. The previous week’s capital reallocation, from high-beta growth cohorts into value-oriented defensive positioning, established the week’s dominant thematic framework. The Dow Jones Industrial Average registered a modest outperformance of +45 basis points while the Russell 2000 small-cap index declined by over 160 basis points. This bifurcation reflects deeper underlying stresses. The White House’s unprecedented decision to permanently withhold October employment and inflation data has created an information vacuum that Fed policymakers are now forced to navigate using stale, backward-looking datasets. This fundamentally compromises the precision of monetary policy calibration.

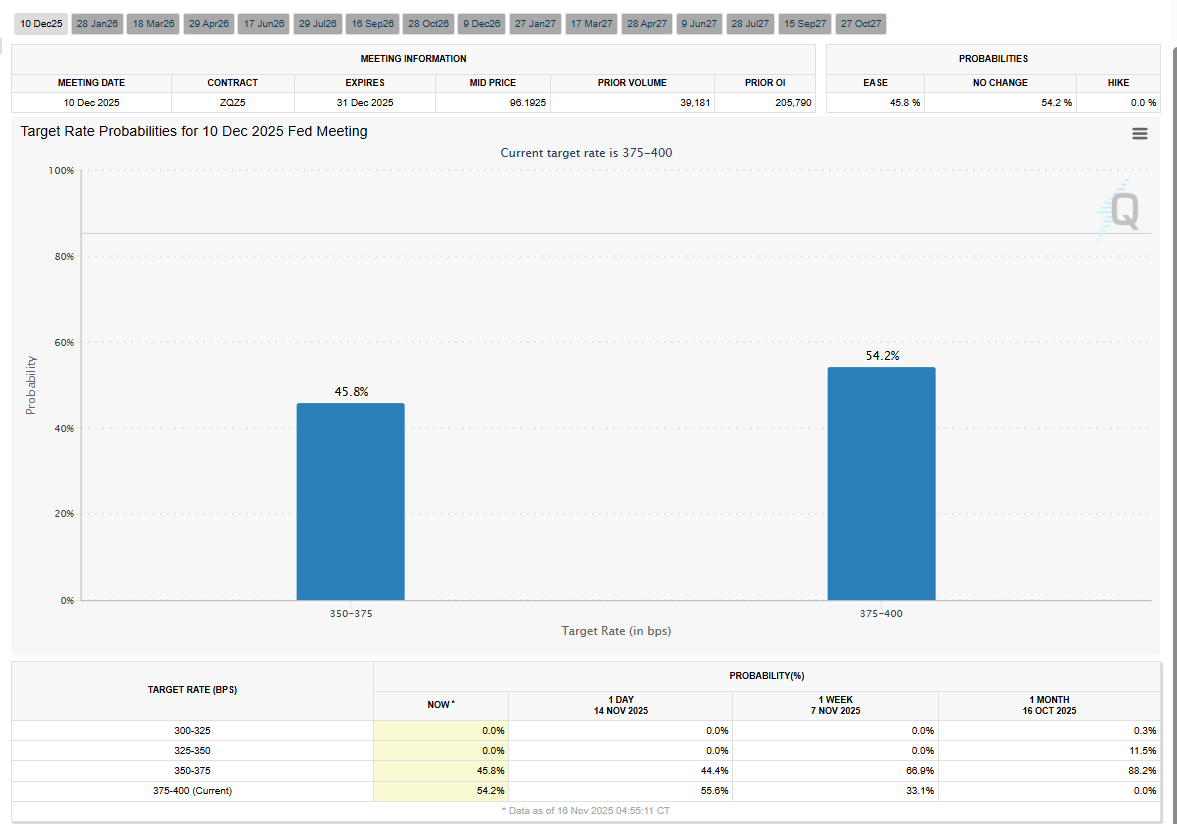
The upcoming economic calendar, while seemingly sparse, carries disproportionate significance. The belated September non-farm payroll report, scheduled for Thursday, will be scrutinized not for its timeliness but for underlying trend deterioration that may have preceded the government shutdown. FOMC minutes from the November meeting will be parsed for dissent nuances, particularly given the now-evenly-divided Committee on December rate cut probabilities (45.8% cut vs. 54.2% pause). Bond auctions face heightened scrutiny as the Treasury Department confronts deteriorating foreign demand metrics, while the 10-year yield’s flirtation with 4.35% threatens to ignite a renewed growth scare.
Geopolitical risk premiums have expanded materially. The Iran-Israel shadow conflict has intensified asymmetrically. Tehran’s proxy network is demonstrating enhanced operational tempo across the Levant, while direct confrontation risk in the Strait of Hormuz has elevated crude option skews to three-month highs. Ukraine-Russia battlefield dynamics have entered an attritional phase where neither side’s claimed territorial gains can offset the war fatigue manifesting in European energy markets and global grain corridors. The Trump administration’s tariff implementation timeline remains deliberately ambiguous, creating a rolling uncertainty discount across multinational equity valuations and supply chain-dependent sectors.
Previous Week’s Market Recap: Factor Unwind and Information Asymmetry
The week ending November 15, 2025, will be remembered as the week markets were forced to price assets without the stewardship of critical economic data. This underscores how modern algorithmic and discretionary trading frameworks remain dependent on quantitative anchors. The federal government’s reopening midweek provided only partial relief; the Bureau of Labor Statistics remained effectively muzzled as the White House exercised executive prerogative to suppress October’s employment and inflation releases permanently. This data embargo represents a fundamental break from decades of institutional transparency, forcing the Federal Reserve and market participants to operate with a two-month blind spot in an economy already exhibiting signs of momentum deceleration.
Capital migration patterns revealed profound risk-off sentiment disguised as factor rotation. The 200+ basis point performance dispersion between the Dow and Nasdaq intraweek signaled not healthy rebalancing but rather a coordinated unwind of crowded momentum positions. The iShares Russell 1000 Growth ETF (IWF) underperformed its Value counterpart (IWD) by over 300 basis points. Meanwhile, thematic high-beta exposure, as captured in the Innovator IBD 50 ETF (FFTY), Valkyrie Bitcoin Miners ETF (WGMI), and WisdomTree Quantum Computing Fund (WRTM), experienced liquidation cascades reminiscent of the March 2021 Archegos event, albeit at smaller magnitude.
The AI infrastructure complex suffered disproportionately. CoreWeave’s (CRWV) earnings disappointment catalyzed cross-selling throughout the semiconductor capital equipment chain. This was amplified by credit market repricing of ORCL and CRWV CDS spreads, which widened by 75 and 120 basis points respectively. The market’s interpretation is that debt-funded AI capacity builds, once cheered as growth investments, now face refinancing risk in an environment where the Fed’s terminal rate remains uncertain and corporate bond spreads have ceased tightening. SMH, the VanEck Semiconductor ETF, corrected 10.3% from mid-October highs, violating its 50-day moving average on three consecutive sessions before finding tentative support at the lower bound of its post-Liberation Day channel.
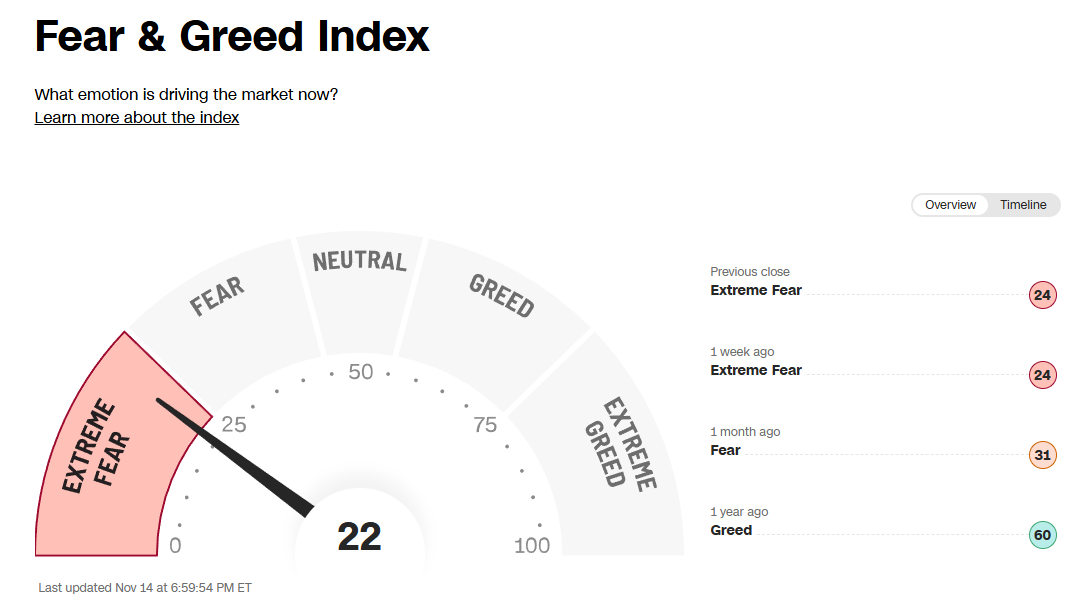
Market breadth, despite flat index performance, showed modest improvement. The NYSE advance-decline line registered a higher low relative to the prior Friday, suggesting the sell-off exhibited selectivity rather than indiscriminate panic. However, this silver lining remains tarnished. Only 40% of S&P 500 constituents trade above their 20-day moving averages, and the 50-day participation metric sits at 38%. These are levels historically consistent with correction phases even when headline indices remain within 2% of all-time highs. This divergence between price and participation explains the CNN Fear & Greed Index’s stubborn residence in “Extreme Fear” territory (reading of 22), a contrarian signal that has yet to manifest as broad-based capitulation.
Small-cap performance (IWM -1.66%) confirmed the risk-aversion thesis. Unlike large-cap indices where share buybacks and index rebalancing provide price support, the Russell 2000’s 1,600+ constituents face margin compression from wage inflation, tariff input cost pass-through, and floating-rate debt service burdens that increase with every hawkish Fed whisper. The index’s violation of its April uptrend line, despite four prior successful tests, suggests a potential shift from consolidation to distribution.
Federal Reserve Policy Matrix: Independence Under Siege
The Federal Reserve’s credibility has entered a twilight zone where institutional integrity collides with political imperatives. The Trump administration’s multifront assault on Fed independence, through data suppression, personnel manipulation, and public jawboning, has created a structural devaluation of forward guidance that markets are only beginning to price.
The Data Suppression Mechanism: The White House’s refusal to release October employment and inflation statistics represents more than political optics; it constitutes a strategic hamstringing of the Fed’s dual mandate execution. Without real-time labor market granularity (JOLTS quit rates, job openings, regional unemployment differentials) or inflation diffusion indices (trimmed mean PCE, supercore services), the FOMC is effectively flying blind through a period of critical economic transition. Governor Lisa Cook’s recent commentary acknowledging “significant uncertainty regarding the true state of employment slack” underscores this handicap. The administration’s rationale, which is to shield public perception from DOGE-related layoffs, reveals a dangerous precedent: economic data becomes a public relations tool rather than a policy input.
Personnel Chess Game: The upcoming January 2026 confirmation hearing for Lisa Cook, whom Trump has publicly accused of fraud, signals the administration’s broader Fed board capture strategy. With Governor Powell’s term expiring May 2026, Trump has already secured effective board control. Michelle Bowman (Trump appointee), Christopher Waller (Trump appointee), and Stephen Miran (Trump’s recent nominee) create a 3-3 deadlock with Biden appointees (Cook, Jefferson, Barr) that paralyzes consensus-building. Miran’s repeated advocacy for 50bps December cuts, an unprecedented move for a Fed governor to pre-commit to specific actions, reveals direct administration influence, transforming monetary policy into a partisan lever.
The 50-Year Mortgage Spectacle: Senior White House Adviser Kevin Hassett’s public endorsement of Trump’s 50-year mortgage proposal demonstrates the intellectual bankruptcy permeating administration economic thought. This product would disproportionately benefit leveraged real estate speculators while doing nothing for genuine affordability. For a potential Fed chair candidate to endorse such a distortionary instrument telegraphs that the administration seeks not sound monetary policy but rather a compliant central bank that monetizes fiscal profligacy.
Market Implications: The confluence of these forces creates a “policy uncertainty premium” embedded across asset classes. The dollar’s inability to rally despite hawkish Fed commentary and rising yields reflects global investors pricing American institutional decay. Foreign central bank demand at Treasury auctions has waned; indirect bidders (proxy for foreign interest) took down just 62% of the 10-year reopening last week, the lowest since October 2023. This reticence, combined with the dollar’s rejection at its 200-day moving average, validates our structural bearish thesis. DXY is destined for a retest of summer lows near 95, with eventual penetration toward the 200-month moving average at the 92-handle.
December Meeting Outlook: The odds have shifted dramatically. As of Friday’s close, fed funds futures implied:
54.2% probability of a 25bps cut (to 3.50-3.75%)
45.8% probability of a hold (at 3.75-4.00%)
The determining variable is the FOMC’s interpretation of “progress toward price stability” versus “labor market deterioration.” With inflation breakevens remaining muted (5-year TIPS breakeven at 2.18%), the inflation risk appears contained. However, the employment cost index’s persistent 4%+ growth and unit labor costs rising at 3.8% YoY provide hawks ammunition. The deciding factor may be financial conditions. The Bloomberg US Financial Conditions Index has tightened by 45bps over the past two weeks, equivalent to a de facto rate hike. If this persists, even hawks may concede to a cut to relieve pressure on credit markets.
Key Commodities & Digital Assets
A. Crude Oil (CL) Analysis: The “Glut” Is a Narrative, Not a Reality
The prevailing market narrative of an “oil glut” is fundamentally flawed and appears to be driven by sentiment rather than data.
The Fundamental Case: The “glut” thesis is contradicted by inventory data, which shows continued tightening even as prices have moderated. This suggests the drawdowns are structural (i.e., consumption-driven) rather than speculative. The demand risk for 2026 is skewed to the upside, driven by coordinated global easing measures and a potential structural recovery in China.
The Geopolitical Case: As established in Section V, the geopolitical risk premium for crude is escalating, not receding. The Iranian seizure of the Talara tanker is a clear signal that the Strait of Hormuz is not safe. This provides a hard, asymmetric floor for crude prices.
The Technical Case: The technical picture is the most compelling of all.
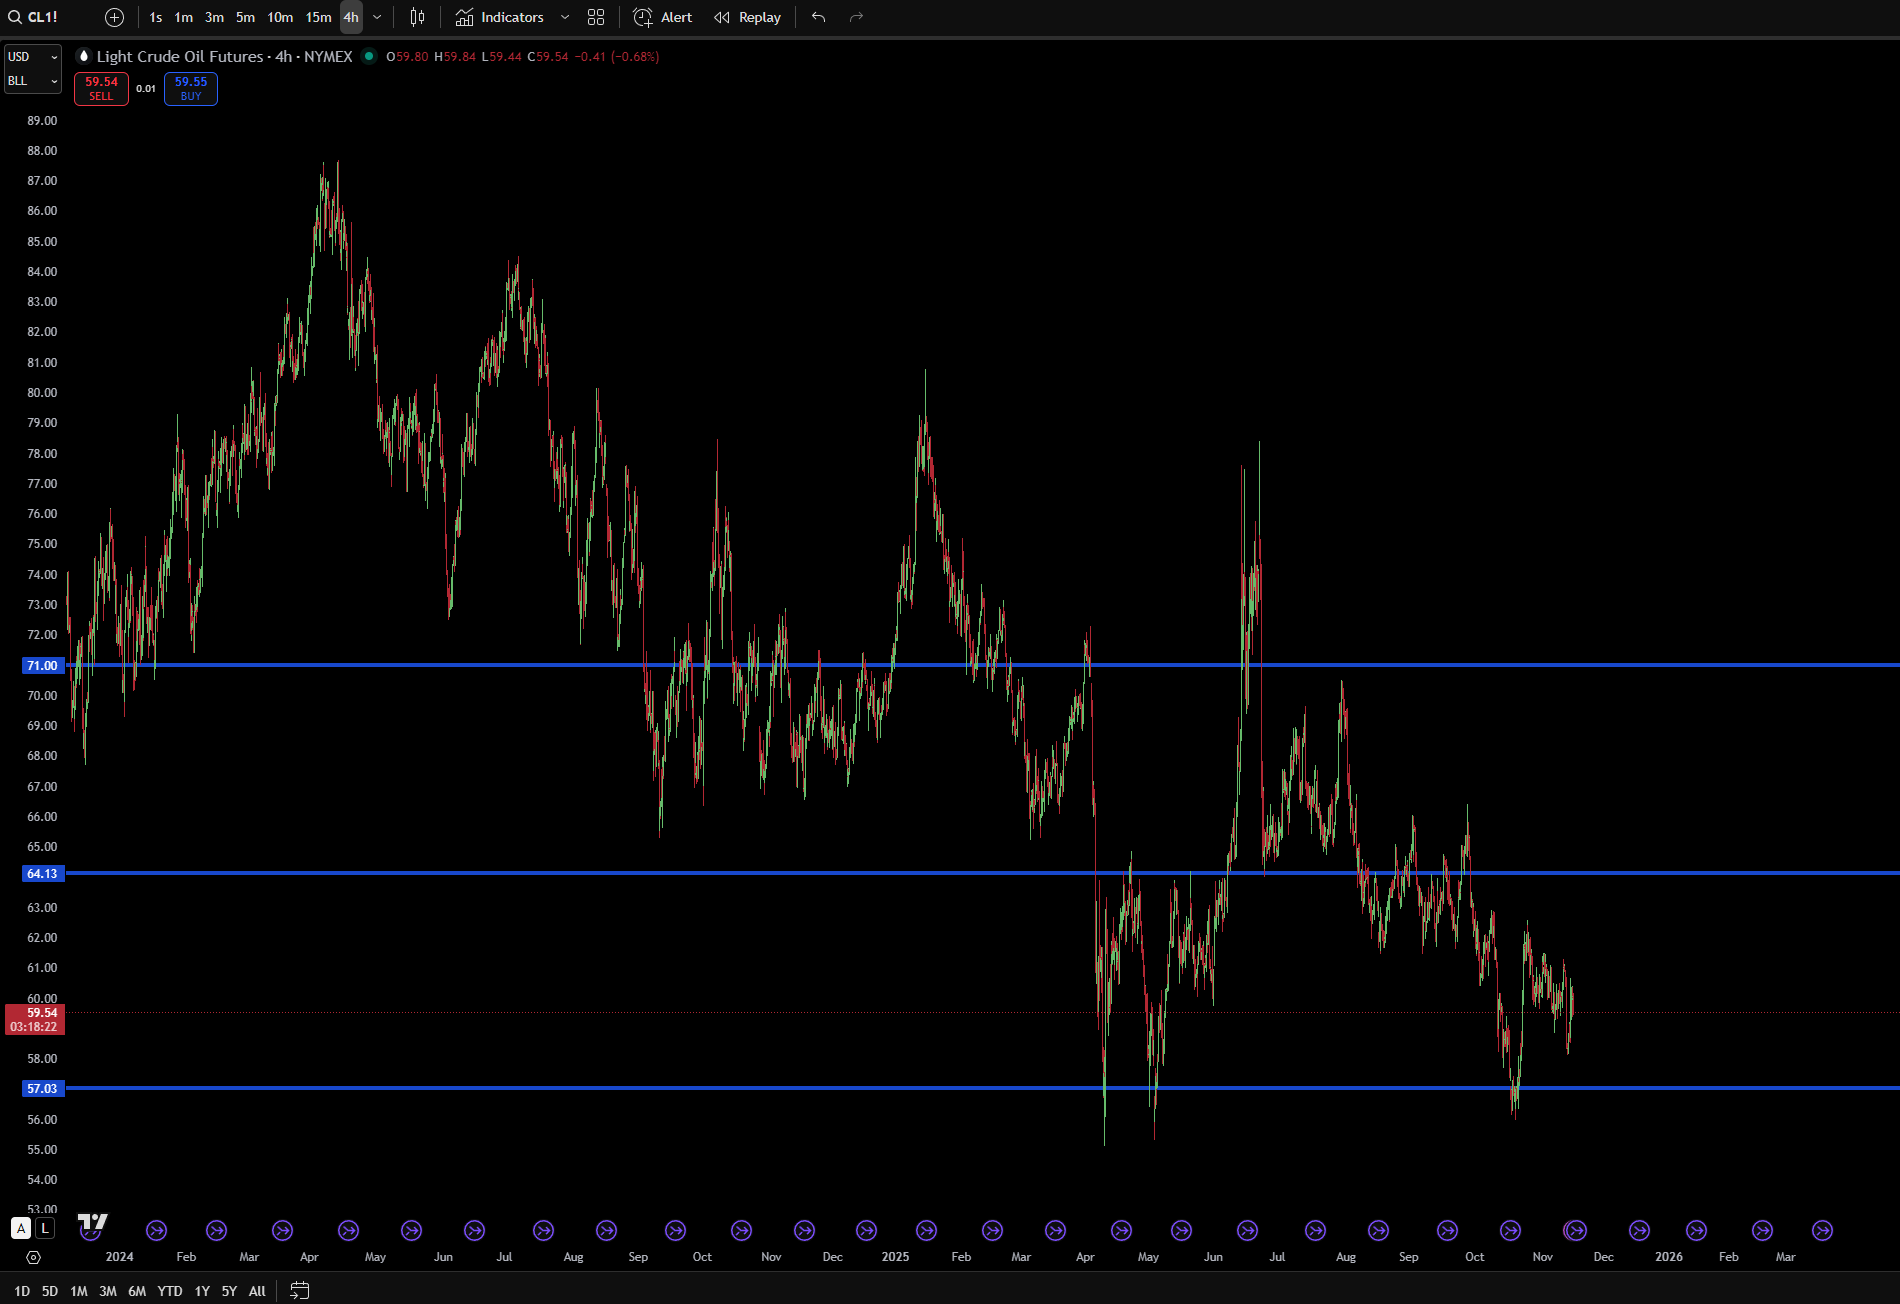
WTI crude has successfully formed a bottom, re-testing the same lows seen during the “Liberation Day” selloff.
A “rounded bottom” formation is taking shape on the daily chart. The key breakout level for a meaningful, sustained rally is a reclaim of $63.5/bbl. This level represents a critical cluster of resistance, including both the 100-day and 200-day moving averages.
Most importantly, the weekly chart is displaying a growing positive divergence. This is a classic, powerful technical signal where price re-tests its lows while momentum oscillators (like the RSI) make higher lows. This indicates that downward momentum is completely exhausted and a major trend reversal is building.
B. Bitcoin (BTC) Analysis: A High-Beta Macro Asset.
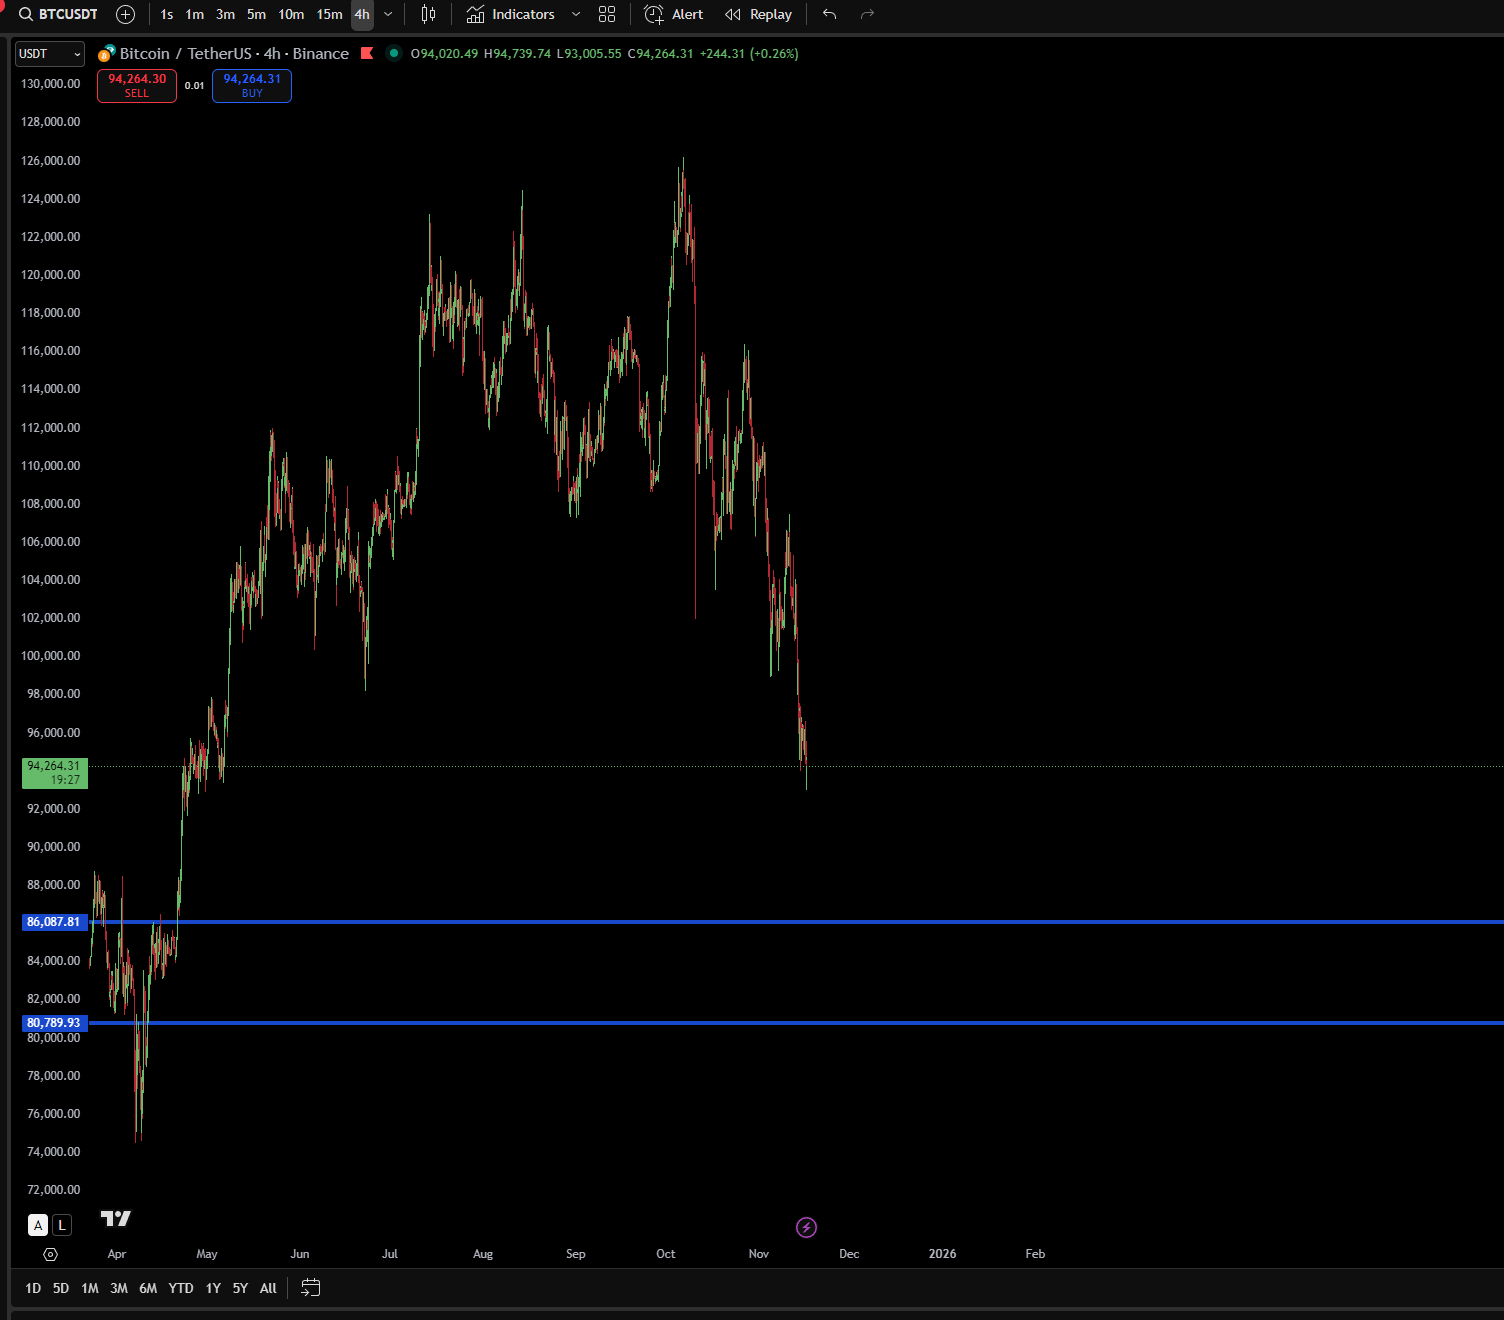
Bitcoin is currently functioning as a high-beta macro asset, not a “digital gold” or a safe-haven. It was a core component of the “Higher-beta / Thematic” unwind, collapsing 16% in the recent washout.
The asset’s price action (currently ~$95,879) is being dictated entirely by traditional macro factors. The recent sharp drop from its high near $101,640 is directly attributable to:
The Hawkish Fed: A “no rate cut expected” stance from Fed speakers is toxic for zero-yield risk assets.
Rising Treasury Yields: Capital is being “drawn to safer bonds,” pulling liquidity from high-volatility assets like Bitcoin.
The Tech Selloff: Bitcoin’s high correlation to the Nasdaq and the “risk-off” environment in tech has caused a sympathetic bleed.
The sentiment in the crypto space confirms the “Extreme Fear” seen in equities. The Bitcoin-specific “Fear & Greed Index” has crashed to a reading of 10, its lowest level since the “COVID meltdown”. Bitcoin is acting as a simple barometer for market liquidity and risk appetite. Its fate this week is not independent; it is tied directly to the same two catalysts as the Nasdaq: the tone of the FOMC Minutes and the market’s reaction to NVDA earnings
