
Weekly Market Outlook 11/30/2025

Hello traders,
Hope you had a great long weekend and got to spend time with your loved ones.
Markets open this week at a rare inflection point where structural liquidity shifts collide with deliberate silence.
A triad of converging risks is defining the market environment: (1) structural liquidity shifts, (2) geopolitical recalibrations, and (3) an administrative “fog of war” in macroeconomic data. The historic 43-day U.S. government shutdown has created a statistical vacuum; a “Data Fog” where key economic indicators are delayed, canceled, or subject to major revisions. This informational blind-spot forces the Federal Reserve to steer monetary policy with limited visibility, a predicament Chair Jerome Powell likened to “driving in the fog.”
Simultaneously, this week marks a critical pivot in global liquidity dynamics. As of December 1, the Federal Reserve has officially ended its Quantitative Tightening (QT) program, concluding the reduction of its bond holdings. This end of QT; essentially stopping the drainage of liquidity from the system; is a structural shift that many retail traders may underappreciate. It fundamentally alters the supply-demand mechanics of the Treasury market and, historically, coincides with expanded valuation multiples in high-beta assets like the Nasdaq 100 and Bitcoin. In other words, the liquidity headwind for risk assets that persisted for nearly two years is easing.
However, the fresh liquidity tailwind is juxtaposed against acute geopolitical volatility. The Trump administration’s aggressive “deal-making” diplomacy introduces binary, hard-to-price risks into markets; particularly in energy and commodities. High-stakes negotiations are underway on a controversial peace plan for Ukraine and a so-called “massive victory” trade deal with China, rewriting expectations for crude oil and agricultural commodity prices. At the same time, the Middle East teeters on the edge of escalation, with Israel imposing a December 7 deadline related to Hezbollah’s presence in southern Lebanon.
Realtime Discord access with equity positions tracker, intraday orderflow & option dealer summaries included with the paid newsletter membership . Click here to subscribe.
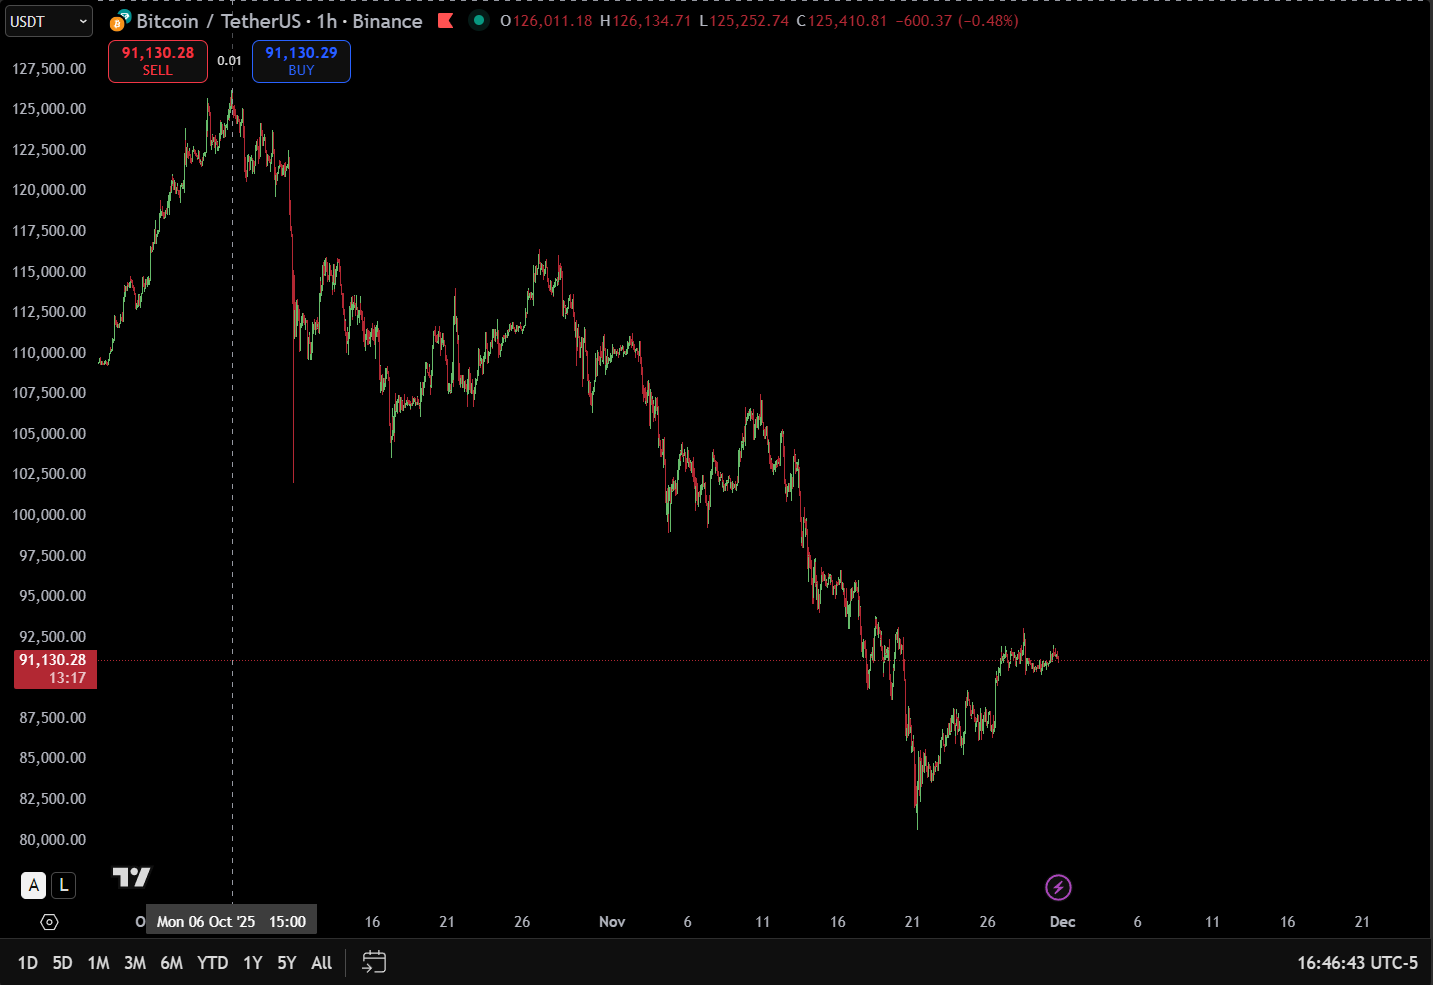
Equity markets reflect this cross-current of forces. The S&P 500 (ES) is hovering near all-time highs around 6,859, buoyed by resilient consumer spending and a seasonal “Santa Claus rally” narrative. Yet beneath the surface, a rotation is brewing. The Nasdaq 100 (NQ) is lagging, pressured by valuation concerns in semiconductors and fears of an “AI bubble” deflating. In contrast, Bitcoin (BTC) is decoupling from equities, supported by a “Strategic Reserve” narrative of corporate BTC accumulation as a treasury asset.
Monetary Policy Analysis: The Blackout, the Balance Sheet, and the December Dilemma
The “Close Call” Meeting and the Fed Blackout Dynamics
The Federal Reserve has entered its customary pre-meeting blackout period as of Saturday, Nov 29, 2025. For the week leading up to the pivotal December 9–10 FOMC meeting, Fed officials will offer no public guidance. This silence creates a dangerous vacuum at a time when markets are struggling to gauge the likelihood of a December rate cut.
Notably, the rate outlook has swung dramatically over the past two weeks. In mid-November, interest rate futures had priced in about a 90% chance of a third consecutive 25 bps rate cut in December. However, the Fed’s recent communications forced a hawkish repricing. In his final remarks before the blackout, Chair Powell cautioned that a December cut is “not a foregone conclusion,” noting there are “strongly different views” within the committee on the appropriate policy path. As a result, the implied probability of a cut has fallen to roughly 60–70%. The yield curve is now highly sensitive to incoming data, knowing the Fed is divided and no longer guiding expectations until decision day.
Blackout implications: During this blackout, there is no “Fed whisper” channel to calm or clarify market reactions. Typically, Fed speakers nudge expectations in the run-up to a meeting to avoid market shocks. Without that safety valve, any significant data release this week; for example, ISM Manufacturing PMI or the ADP Employment report; could trigger unfiltered, algorithmic volatility in bonds and beyond. There will be no Fed official stepping in to “walk back” an overreaction until the meeting, so expect outsized moves if data surprises occur.
Structural Pivot: The End of Quantitative Tightening (QT)
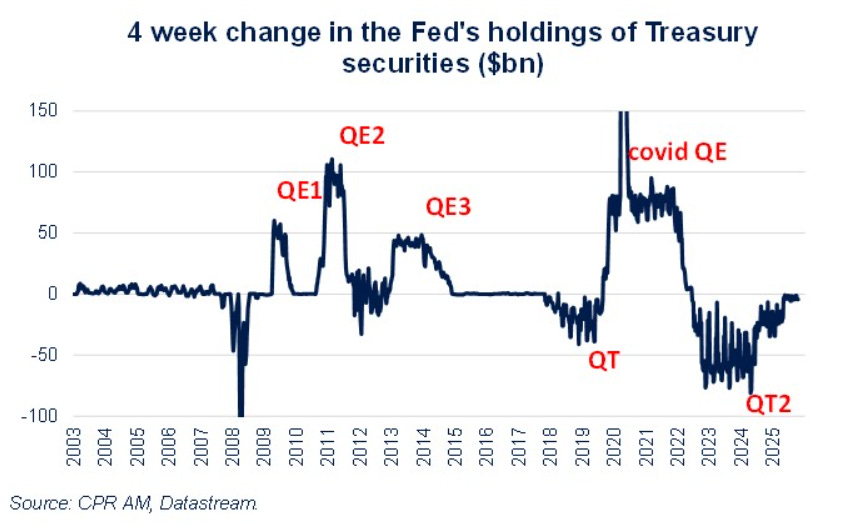
Arguably the most significant monetary development isn’t about interest rates at all, but about the Fed’s balance sheet policy. Chair Powell confirmed that, as of Dec 1, the Fed has stopped reducing its aggregate securities holdings. In effect, Quantitative Tightening is over.
Under QT, the Fed allowed Treasury and mortgage-backed securities to mature without reinvestment, which drained liquidity from the financial system and forced the private market to absorb more government debt. Ending QT marks a structural liquidity shift. Here’s why it matters across asset classes:
Treasury Market Dynamics: The end of QT removes a steady source of supply pressure on Treasuries. With the Fed no longer gradually selling or rolling off holdings, there will be fewer bonds for private investors to absorb. All else equal, this should help cap long-term yields (10-year, 30-year) and prevent a disorderly spike in rates, even if inflation data remains sticky. Lower term premiums ease one headwind for stocks and other risk assets.
Bank Reserves & Risk Appetite: QT had been steadily shrinking bank reserves. Its cessation stabilizes reserve levels in the banking system. History shows that when the Fed’s balance sheet stops contracting (or starts expanding), it often correlates with multiple expansion in growth stocks (e.g., Nasdaq 100) and strength in alternative stores of value like Bitcoin. The mechanism is essentially a portfolio rebalancing channel: with fewer new Treasuries to soak up cash, capital is more likely to flow into equities, crypto, or other riskier assets in search of higher returns.
Overall Liquidity Conditions: Ending QT is a form of stealth easing. Even if the Fed’s policy rate remains high, a neutral-to-expanding balance sheet makes financial conditions more accommodative at the margin. We now have a divergence where the Fed’s nominal stance is tight (rates are high), but underlying liquidity is quietly loosening. This could lead to easier overall financial conditions despite no rate cut yet.
The “Data Fog” and Policy-Error Risk
The current policy backdrop is uniquely perilous because of the macroeconomic data blackout caused by the government shutdown. Statistical agencies are scrambling through a backlog of delayed reports, creating a distorted calendar where outdated data is released alongside current data. Traders and policymakers alike must parse this mix carefully.
For instance, this Friday (Dec 5) the Personal Consumption Expenditures (PCE) inflation report due is actually for September data. In a normal year, September’s PCE would have been out in late October. Basing a December rate decision on two-month-old inflation data is hazardous; it fails to capture the impacts of recent developments like geopolitical shocks or the holiday shopping surge. In short, trading this week’s policy decisions off stale data can be misleading.
This situation sets up a potential policy-error asymmetry for the Fed’s December meeting:
Scenario A – The Hawk’s Mistake: The Fed could misread the situation and hold off on cutting rates because outdated data (e.g. September inflation) still looks “sticky.” If in reality the economy in November/early December is deteriorating under the weight of previous hikes, the Fed risks overtightening into a slowdown. Maintaining too restrictive a stance would accelerate a downturn.
Scenario B – The Dove’s Mistake: Conversely, the Fed might decide to cut rates preemptively to insure against a perceived recession, perhaps spooked by some weak survey data or geopolitical risks. If the economy is actually re-accelerating (as suggested by, for example, surprisingly strong corporate earnings guidance from companies like Salesforce), an early cut could reignite inflation expectations and prove premature.
Neither mistake is easily fixed, and the FOMC knows it. The October 28–29 meeting minutes reveal a committee deeply divided on how to proceed. Some members argued that risks have shifted to the downside for employment (favoring immediate cuts), while others pointed to recent upticks in inflation and new tariff pressures as reasons to stay on hold. This lack of internal consensus is a major reason bond markets have been so volatile; even the Fed doesn’t have a unified view of the economy right now. It also means the stakes for incoming data this week are extremely high, since different factions of the Fed will seize on different data points to justify their stance.
The Macro-Economic Landscape: Navigating the Data Fog
The economic calendar for this week is a minefield of delayed reports and timely indicators. It’s critical to distinguish between “hard” data (mostly stale or delayed) and “soft” data (more up-to-date surveys). Traders should weight current surveys (like PMIs) more heavily than lagging reports (like September PCE or income figures) when gauging market impact.
Weekly Economic Calendar (Dec 1–5, 2025)
Monday, Dec 1:
09:45 AM: Manufacturing PMI (Nov): High importance. Forecast ~51.9 (S&P Global). A reading above 50 signals manufacturing expansion.
10:00 AM: ISM Manufacturing PMI (Nov): Critical. Consensus range 48.7–52.0. A move back above 50 would confirm a “soft landing” scenario for the economy.
10:00 AM: Construction Spending (Oct): Medium. Previous +0.2%. Offers a health check on the housing and construction sector.
1:00 PM: Fed Chair Powell speaks (Stanford University): High. This is likely a scripted, academic panel discussion. Given it’s just before the blackout, do not expect any unscripted guidance, but markets will still tune in for any hints.
Time TBD: GDPNow Update (Atlanta Fed): Medium. Last estimate was 3.9% GDP growth. Watch for any significant revision after the morning’s manufacturing data.
Tuesday, Dec 2:
All Day: Vehicle Sales (Nov): Medium. A real-time gauge of consumer demand in auto markets; an important consumer discretionary barometer.
Time TBD: Fed Vice Chair Bowman testifies: Medium. Bowman is often a hawkish voice; her comments (even if pre-prepared) could provide color on regulatory or policy leanings.
Wednesday, Dec 3:
08:15 AM: ADP Employment Change (Nov): Critical. Expected to be very low (~20k) due to strike effects and data issues. This is a private payrolls gauge and will serve as a proxy for the missing official jobs report.
10:00 AM: ISM Services PMI (Nov): Critical. Previously showed weakness. Remember, services make up ~70% of U.S. GDP. If this index falls into contraction (<50), it will stoke recession fears.
Thursday, Dec 4:
08:30 AM: Initial Jobless Claims: High. Last reading was 216k, a historically low level. Weekly claims are the most reliable up-to-date labor market signal right now, given the void of recent monthly payroll data.
Friday, Dec 5:
10:00 AM: PCE Price Index (September): High (but stale). Core PCE is expected ~2.9% YoY. This is the Fed’s preferred inflation metric, but note that it’s two months old. Its relevance is diminished by more recent trends (e.g. October/November energy price drops).
10:00 AM: Personal Income & Spending (September): High (stale). Again, data for September. The spending figures won’t reflect the critical holiday season kickoff, but may still move markets if there are big surprises in savings rates or revisions.
ISM Manufacturing: A Key Real-Time Signal
Among these, Monday’s ISM Manufacturing PMI stands out as arguably the most important data point of the week because it’s timely (November data). The U.S. manufacturing sector has been in contraction (sub-50 readings) for eight consecutive months. If ISM Manufacturing jumps back into expansion territory (say, 51+), it would send a significant bullish signal for “reflation” trades; suggesting economic resilience despite high rates.
Within the ISM report, pay attention to the “Prices Paid” component. In the previous month’s ISM survey, Prices Paid cooled to 58.0. If this sub-index suddenly spikes back above 60 while the headline PMI also expands, it would validate the narrative that inflation is re-accelerating. That outcome could trigger a jump in bond yields (as traders price in a more hawkish Fed) and put downward pressure on rate-sensitive assets like the Nasdaq.
Another vital ISM sub-index is Employment. Previously at a weak 46.0 (indicating manufacturing jobs were still contracting), if the employment component remains soft even as the overall PMI improves, it suggests any manufacturing rebound is coming from productivity gains and efficiency (which is bullish for corporate profit margins). Conversely, if the employment metric also flips into expansion, it might signal emerging wage pressures.
The “Stale” PCE Report vs. a Hot GDP Revision
Friday’s release of the September PCE Price Index creates a cognitive dissonance in markets. Consensus expects core PCE to hold around 2.9% year-over-year; which in normal times would indicate inflation still above the Fed’s 2% target. However, because this data is so delayed, trading off its headline risk is tricky. It’s quite possible algorithmic traders will react to a hotter or cooler-than-expected PCE print in milliseconds. For example, if core PCE prints above 3.0%, expect instant algorithmic selling of Treasury bonds (pushing yields up). But savvy human traders may fade such a move, reasoning that September’s inflation is old news. Since then, we’ve seen a collapse in oil prices and an unexpected trade deal with China; both of which are disinflationary forces for Q4. In essence, by the time we get this PCE data, much of its information is already priced in or irrelevant due to more current developments.
On the growth front, one reason the Fed may lean hawkish is the surprise GDP revision we just saw. Q3 2025 GDP growth was revised up sharply to 3.8% (from an initial 3.3%). This suggests the economy was running much hotter than the Fed realized going into the autumn. Such strength undercuts the case for an immediate rate cut; it indicates the economy handled higher rates better than expected (at least through Q3). For markets, this GDP surprise is a double-edged sword: it’s good news on growth, but it reduces the likelihood of Fed easing in the near term.
Labor Market Opacity
Thanks to the shutdown’s aftermath, the labor market picture is unusually opaque. The Bureau of Labor Statistics delayed the September jobs report by six weeks and canceled the October jobs report entirely. This means we have no official payroll data for October and incomplete data for September; a huge hole in the Fed and market’s understanding of employment trends.
In this vacuum, traders are leaning heavily on proxies. The most watched proxy has been Initial Jobless Claims, which, as noted, are hovering near multi-month lows (last week around 216,000). Such low claims indicate layoffs remain scarce. This is a sign the labor market is still relatively strong despite high interest rates. This resilience runs contrary to the recession narrative and effectively gives the Fed “permission” to hold off on rate cuts if they choose. Ironically, that is bearish for equities in the short run: a robust labor market removes urgency for Fed easing, meaning liquidity-sensitive assets (like tech stocks) might not get the rate relief rally they’d been hoping for. In summary, strong jobs signals enable the Fed to be patient, which could disappoint investors who had bet on an imminent rate cut.
Geopolitics: The Trump Doctrine & the Deal-Maker’s Volatility

The geopolitical landscape has shifted from a grinding status quo to a dynamic phase of high-stakes deal-making under the Trump administration. This “Deal-Maker” approach pursues bold, transactional agreements and brinksmanship, introducing binary outcome risks that markets struggle to price. A single headline can swing sentiment wildly, especially in commodities and foreign exchange, as diplomatic moves create sudden winners and losers.
Ukraine: The 28-Point Peace Plan and Its Market Impact
The conflict in Ukraine remains an epicenter of global risk, particularly for energy markets. Reports indicate a flurry of diplomatic maneuvering around a potential “28-point peace plan” (later reportedly pared down to 19 points in Geneva) aimed at freezing the conflict. While details are closely guarded, leaked elements of the plan suggest significant concessions to Russia in exchange for peace. Key rumored provisions include:
Territorial Concessions: Ukraine would formally cede claims to Crimea and parts of Donetsk and Luhansk, effectively accepting the current lines of control as permanent.
NATO Status: Ukraine would amend its constitution to pledge neutrality; committing to not join NATO, addressing one of Moscow’s core demands.
Demilitarization: Limits on Ukraine’s military forces are proposed (e.g. capping troop levels around 600,000 and banning foreign troop deployments on Ukrainian soil).
Sanctions Relief: Critically for markets, the plan calls for lifting many sanctions on Russia and even inviting Russia to rejoin the G7 (making it the G8 again).
Market implications of such a deal are profound but two-edged:
Oil Prices: Bearish: The prospect of sanctions being lifted is a Sword of Damocles over the oil market. It could officially bring Russian crude exports fully back into the global fold, exacerbating an oversupply situation anticipated in 2026. Oil traders, eyeing this, have been cautious; the mere possibility of a peace deal is keeping a lid on crude prices as it implies a flood of supply down the line.
European Equities: Bullish: A ceasefire in Ukraine would remove a major geopolitical risk overhanging Europe. It would likely lower energy costs and improve business confidence in the Eurozone, acting as a tailwind for European stock indices (e.g., Germany’s DAX could benefit from cheaper energy inputs and reduced existential threat).
Event Risk: High: That said, negotiations are unfolding alongside ongoing military activity. Notably, Russia has intensified missile strikes on Kyiv even amid talks, a classic “negotiate by fire” tactic. The situation could swing abruptly. If talks collapse, we could see violent snap-back rallies in commodities like oil and wheat, as traders who faded prices on peace hopes rush to cover shorts.
Middle East: The Litani River Deadline
While global attention focuses on Europe, an immediate flashpoint looms in the Middle East. Israel has reportedly set a December 7 deadline for the Lebanese Armed Forces to disarm Hezbollah militias south of the Litani River in Lebanon. This ultimatum puts the region on edge as the week progresses toward Friday.
The timeline: The deadline expires at the end of this trading week, which means traders must account for potential weekend conflict risk. As Dec 7 nears, we anticipate implied volatility will rise in crude oil options, especially out-of-the-money call options. Traders and hedgers are likely bidding up oil calls as insurance against a sudden escalation over the weekend. In practical terms, anyone short oil or related assets into the weekend may hedge by purchasing calls that would pay off if oil spikes on war news.
Iran’s Nuclear Wildcard: Further complicating the picture, intelligence reports confirm that Iran continues to quietly pursue nuclear technology via front companies. If Israel perceives a red line being crossed with Iran’s nuclear advancement, an Israeli preemptive strike on Iranian facilities cannot be ruled out. Such a scenario would be the ultimate Middle East “black swan” for markets: it could send oil prices gapping into the $100+ per barrel territory literally overnight. Market participants are on alert, as any hint of this risk turning real would dramatically change oil’s risk profile.
US–China: A “Massive Victory” Trade Deal
In a surprising turn of events, the Trump administration announced a major trade accord with China on November 1, 2025, touted domestically as a “massive victory” deal. This breakthrough significantly de-escalates the trade tensions that have lingered for years. Key points of the agreement include:
Terms: China agreed to halt exports of fentanyl precursors (a big win for the U.S. opioid crisis efforts) and to suspend its export controls on critical rare earth metals like gallium and germanium (essential for semiconductors and defense technologies). In return, the U.S. will suspend certain tariffs on Chinese goods and extend the existing exemptions (Section 301 tariff exclusions) that were set to expire.
Specific Tariff Relief: Notably, the deal removes China’s retaliatory tariffs that were impacting U.S. farmers and exporters. For example, Beijing will eliminate the 15% tariffs on U.S. agricultural products such as chicken, wheat, corn, and cotton, and drop the 10% tariffs on soybeans and pork. This is a boon for American agriculture, removing punitive costs that have weighed on farm incomes.
Macro Impact: This deal is explicitly disinflationary for the U.S.. By lowering tariffs and ensuring supply of key inputs (like rare earths), it reduces cost pressures on U.S. manufacturers and importers. It also sharply reduces the risk of a renewed trade war, which had been a major source of uncertainty. The stock market has responded positively; part of the reason the S&P 500 has been resilient even in the face of high bond yields is that corporate margins are getting a buffer from improved trade terms. In short, trade diplomacy is offsetting some of the monetary tightening’s drag.
Fixed Income: The Silent Arbiters of ValueThe bond market, often dubbed the “smart money,” continues to flash cautionary signals about the sustainability of the equity rally. Despite stocks near highs, Treasury yields remain elevated and the yield curve is sending mixed warnings. This week, fixed income will play a critical role as an arbiter of market valuation, so we examine recent developments there closely.
Treasury Auction Digest : Supply Met with Solid Demand
The U.S. Treasury just passed through a heavy week of debt issuance, and the auction results give insight into global demand for U.S. bonds in the face of mounting deficits (sometimes referred to as the “Trump Deficit”). Here’s the auction scorecard from last week’s major auctions:
2-Year Note: Stopped at a yield of ~3.489% (slightly lower than the previous auction’s 3.504%). The bid-to-cover ratio was a healthy 2.71, indicating solid demand for the short end.
5-Year Note: Stopped at ~3.562% (virtually unchanged from the prior 3.561%). Demand was steady, suggesting investors are comfortable around these yield levels for intermediates.
7-Year Note: Stopped at ~3.79%, notably lower than the prior 3.953%. This drop in yield implies very strong bidding interest in the 7-year issue.
Key takeaway: The standout here was the 7-year auction. Such robust demand for the 7-year suggests that, despite concerns about rising U.S. debt, there are ample buyers (foreign investors, pensions, etc.) willing to lock in ~3.8% yields. This alleviated fears of a disastrous auction “tail” and calmed the bond market, at least for now. The fact that the 2-year yield also edged down from the previous auction indicates the market still expects some Fed easing down the line (even if timing is uncertain). In short, investors are not demanding higher yields to absorb new debt; a positive sign that interest rates might stabilize.
Watching the Yield Curve : Steepening from the Long End
The U.S. yield curve remains inverted (short-term yields above long-term yields), but we’ve seen some bearish steepening recently, driven by the long end. In other words, long-term yields have been rising relative to short-term yields, reducing the inversion. This kind of move, a “bear steepener,” can happen when inflation or deficit concerns push long rates up while the Fed holds short rates steady.
Currently, the 10-year Treasury yield is holding above the critical 4.0% level. As long as 10-year yields stay in the 4.0%-4.1% range, equity valuations can live with it. However, there’s a widely watched “bond vigilante” threshold around 4.25% on the 10-year. If yields break above 4.25% in a decisive way, it would significantly pressure equity valuations; particularly the growth stocks that dominate indices like the Nasdaq, because higher discount rates mathematically undermine lofty P/E ratios.
Thanks to the strong 7-year auction and other factors, we seem safe for now (10-year is sub-4.1%). But the market will be vigilantly monitoring upcoming auctions and inflation data. Any sign that demand for Treasuries is weakening (or inflation expectations are rising) could send long yields testing that danger zone again. For now, bond investors are cautiously anchoring yields, effectively giving a tentative green light to the equity rally; but this can change quickly, so stay tuned to the fixed income pulse.
Equity Index Futures
Despite the macro crosswinds, U.S. equity indices remain in an overall uptrend, with some internal rotation. We focus on futures for the S&P 500 and Nasdaq 100 to gauge technical and fundamental drivers, and identify trade setups.
S&P 500 (ES) Outlook
Price Context: The S&P 500 E-Mini is trading around 6,859, just shy of its all-time highs. After a modest +0.5% post-Thanksgiving rally in thin volume, the index is consolidating gains. Technical Structure: The S&P remains in a steady
