
Weekly Market Outlook 1/25/2026
Fed week

(An unusual snow storm kept me indoors this weekend, giving me time for a more detailed post.)
Hello Traders,
Wall Street enters the final week of January perched at a familiar yet precarious position: near record highs but beset by crosscurrents that demand the attention of even the most seasoned traders. The Federal Reserve convenes this week for its first policy meeting of 2026, a gathering that will test the market’s conviction that interest rates have peaked and that cuts remain in the offing, if not imminently, then at least by summer.
Beyond the Eccles Building, the forces impacting markets this week extend to oil fields in the Persian Gulf, battlefields in Ukraine, and the corridors of trade policy in Washington. Index futures have consolidated beneath psychological barriers, bitcoin has stalled below the vaunted $90,000 level, and crude oil oscillates between supply gluts and geopolitical risk premiums. For traders and investors alike, the week of January 26 through 30 promises to deliver the kind of high-stakes drama that defines modern financial markets.
Snow day Giveaway: Restack and like this post for your chance to win a free year of paid subscription. Three lucky subscribers will be selected. If you are already a paid subscriber, you get a year comped on your account.
Realtime Discord access with equity positions tracker(new website rolling out to select subscribers), intraday orderflow & option dealer summaries included with the paid newsletter membership . Click here to subscribe.
The Federal Reserve’s January Meeting
A Pause That Speaks Volumes
When the Federal Open Market Committee concludes its two-day meeting on Wednesday, January 28, at 2:00 p.m. Eastern Time, virtually no one on Wall Street expects a change to the federal funds rate. The benchmark overnight lending rate will almost certainly remain anchored in the 3.50% to 3.75% range, where it has resided since the concluding rate cuts of 2025.
Yet the absence of action should not be mistaken for a lack of significance. In the peculiar theater of central bank communications, what Jerome Powell says, and equally important, what he declines to say, during his 2:30 p.m. press conference could prove more consequential than any rate adjustment.
“The market has largely priced out any chance of a January move,” said one senior strategist at a major Wall Street bank on signal chat who requested anonymity to speak candidly about Fed expectations. “But the forward guidance game is where the real money gets made or lost. Powell has to thread a needle between acknowledging that inflation remains sticky and not spooking a market that’s counting on cuts by the back half of the year.”
The December Consumer Price Index, released on January 13, showed headline inflation running at 2.7% year-over-year, stubbornly above the Fed’s 2% target but well below the peaks above 9% that haunted policymakers in 2022. The Producer Price Index for November came in at 3.0%, with fresh December data due on Friday, January 30, which could reshape expectations heading into the February meeting.
The Arithmetic of Rate Cut Timing
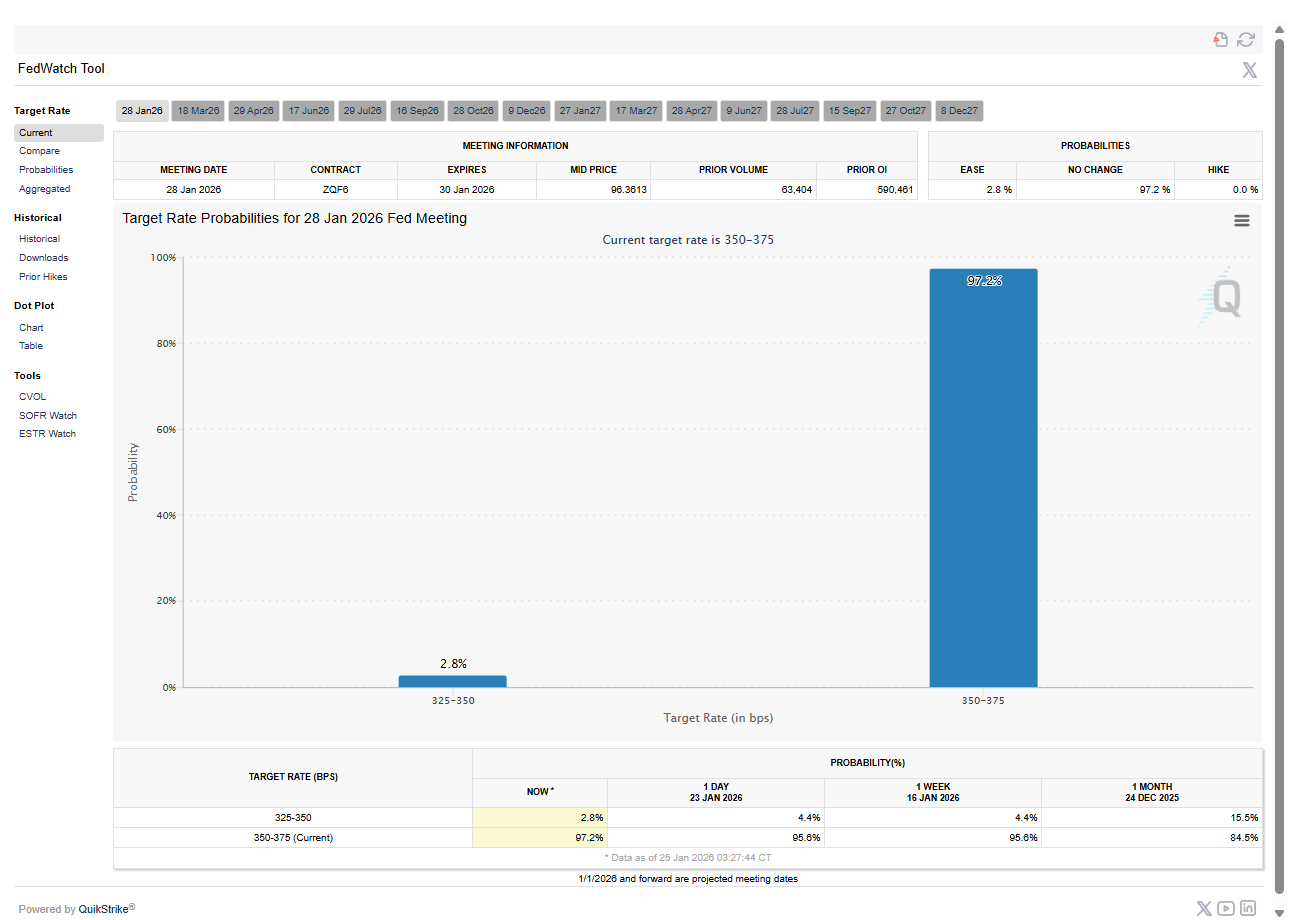
Traders in interest-rate futures markets have been steadily pushing out their expectations for the first rate cut of 2026. Where some had hoped for action as early as March or April, the consensus has now shifted to June at the earliest, with many market participants penciling in July or later.
This shift reflects a sobering reality: the “last mile” of the inflation fight has proved more arduous than central bankers anticipated. The goods inflation that drove the initial surge has largely receded, courtesy of healed supply chains and normalized inventory levels. But services inflation, driven by wages, shelter costs, and healthcare expenses, has demonstrated remarkable staying power.
The Fed is in a difficult spot.They’ve made tremendous progress on inflation, but they can’t declare victory prematurely. And with the labor market still reasonably tight, they have the luxury of patience. I’d expect Powell to emphasize that patience in his remarks.
The challenge for equity markets is that “higher for longer” interest rates impose a cost. Growth stocks, whose valuations are particularly sensitive to the discount rate applied to future earnings, face headwinds when bond yields rise. The technology-heavy Nasdaq-100, which has been the market’s locomotive since the artificial intelligence enthusiasm took hold in 2023, could be especially vulnerable to any hawkish surprise.
What to Watch in Powell’s Remarks
Market participants will parse every syllable of Powell’s press conference for clues about the Fed’s reaction function. Several key themes warrant particular attention:
Inflation characterization: Does Powell describe inflation as “persistent,” “sticky,” or “gradually moderating”? Each adjective carries different implications for policy timing.
Labor market assessment: Will the Fed chairman emphasize continued strength, suggesting less urgency to cut rates, or emerging softness that might accelerate the timeline?
Financial conditions: The Fed has grown increasingly attentive to broader financial conditions, including equity valuations, credit spreads, and the dollar’s exchange rate. Any commentary on asset prices could move markets.
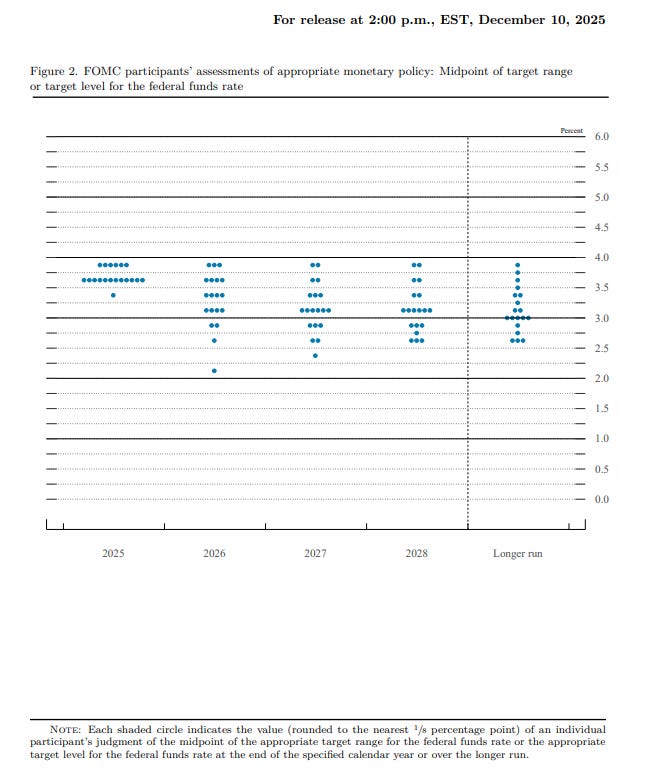
Forward guidance language: The December meeting’s statement and dot plot implied a gradual normalization of rates throughout 2026. Will Powell affirm that path or suggest it may be reassessed based on incoming data?
The stakes are considerable. A more hawkish-than-expected tone could send the 10-year Treasury yield, currently around 4.25%, climbing toward 4.5% or beyond, pressuring equity valuations across the board. A more dovish message, by contrast, could provide the catalyst for index futures to break through their recent consolidation ranges and establish new record highs.
Take advantage of APEX’s 50% promo code and pass account in one day. Also $40 resets on your accounts. Use code ALGO or alternatively just click the button below
Index Futures Analysis
E-mini S&P 500: Consolidation Below a Psychological Barrier (Algorithmic levels at the end of the post)
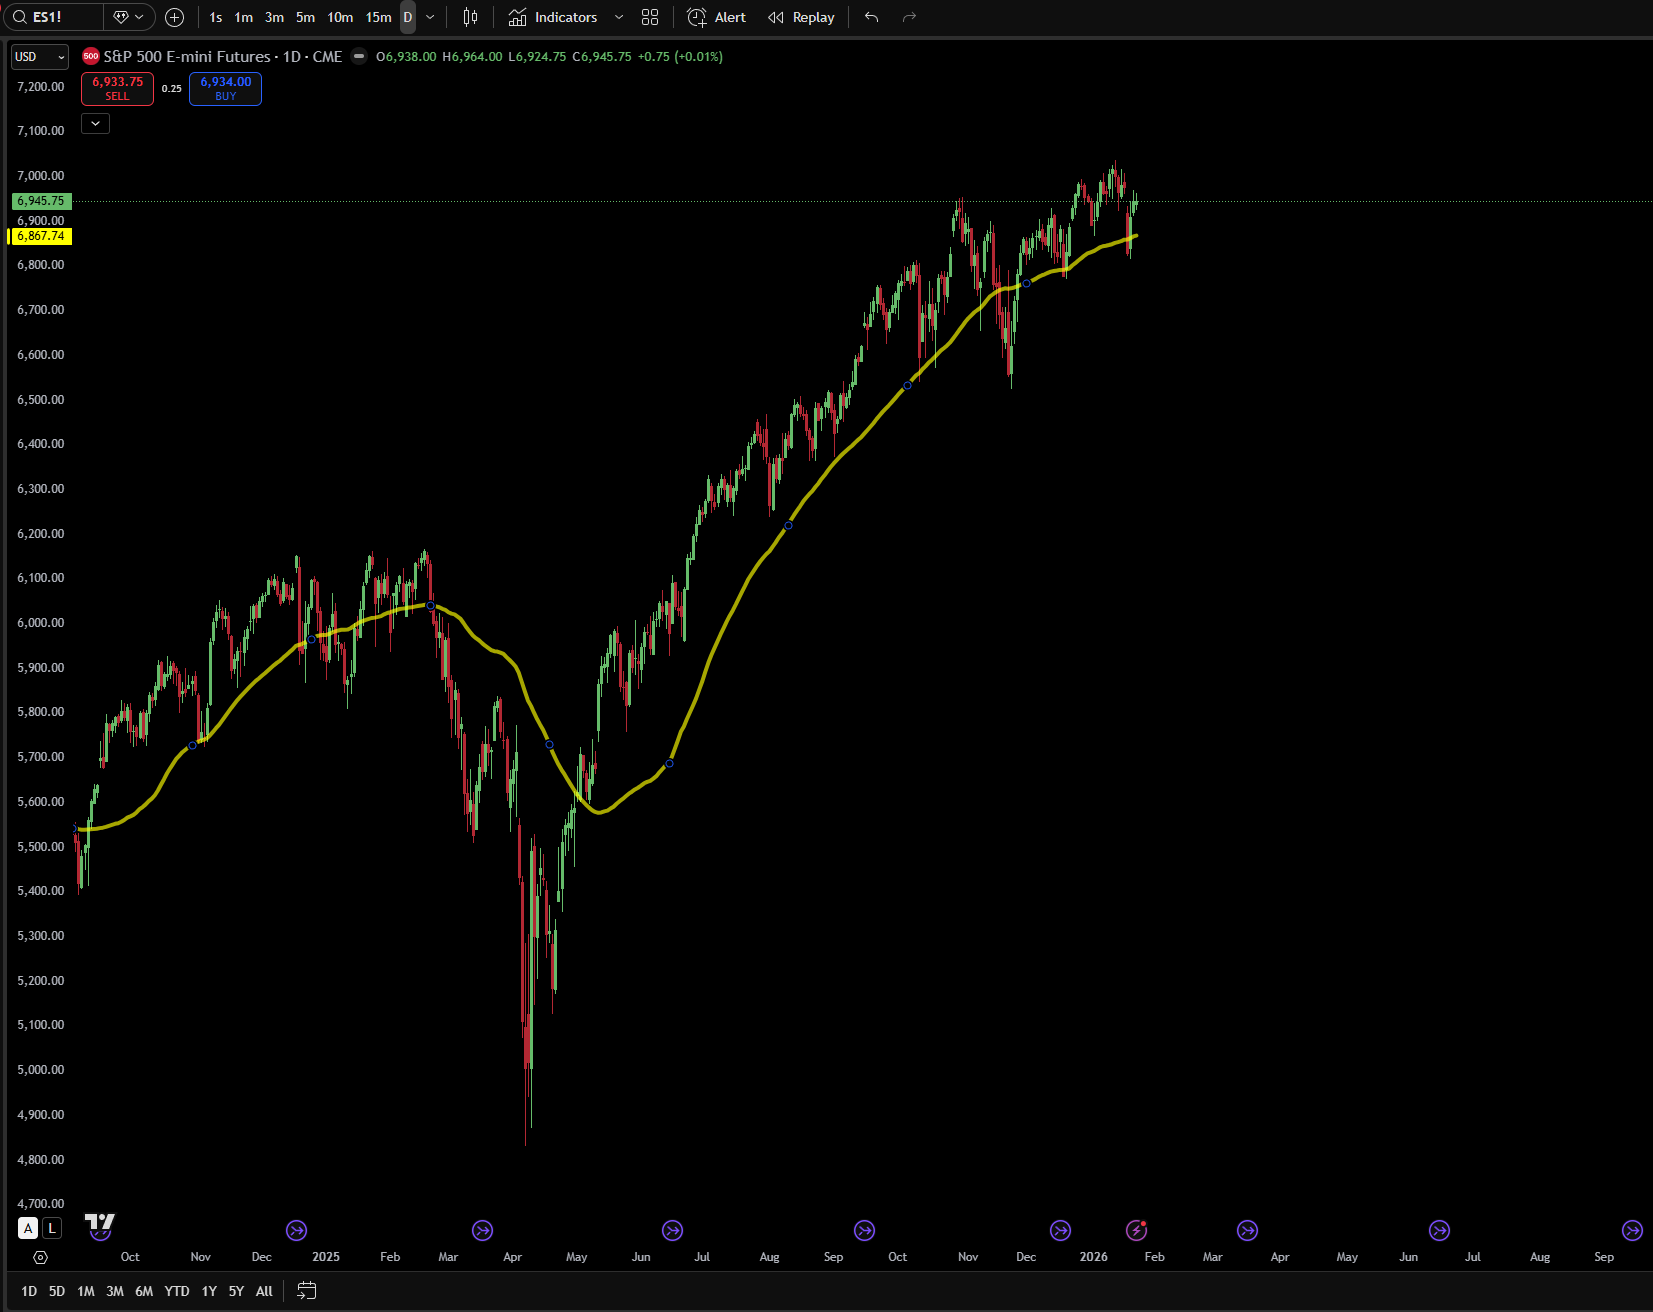
The E-mini S&P 500 futures contract, the benchmark vehicle for institutional traders seeking exposure to America’s largest companies, has spent recent weeks consolidating beneath the psychologically significant 7,000 level. This sideways trading action comes after an impressive rally that began in April 2025 and carried the index to successive record highs through the autumn.
Such consolidation is neither unusual nor inherently concerning. Extended rallies require periods of digestion, allowing valuations to normalize and new buyers to enter at what they perceive as sustainable levels. The 50-day simple moving average, currently situated around 6,850, has served as a reliable support level on each of the market’s recent pullbacks.
What we’re seeing is textbook behavior after a strong impulse move. The market rallied hard, investors grew cautious at round-number resistance, and now we’re watching to see whether buyers or sellers gain the upper hand. The good news for bulls is that every test of support has been met with buying. That’s constructive.
The key technical levels for ES futures are relatively well-defined(more levels at the end of the post). Overhead resistance awaits at 7,000, a level that represents both a psychological barrier and, more practically, an area where many traders have placed profit-taking orders. A decisive break above 7,000, defined as multiple daily closes accompanied by expanding volume, would likely trigger a wave of momentum buying that could carry prices to 7,200 or higher in short order.
On the downside, the 6,850-to-6,880 zone represents what technical analysts(also known as male-astrologers) call the “line in the sand.” This area has been tested multiple times and has held on each occasion. A failure to hold this support would mark a significant technical deterioration, opening the door for a deeper correction toward the 6,600-to-6,650 weekly support zone, a decline of roughly 4% from current levels.
The fundamental backdrop remains broadly supportive. Corporate earnings, while growing at a more modest pace than in prior quarters, continue to exceed expectations for the majority of S&P 500 components. The artificial intelligence investment cycle shows no signs of abating, with major technology companies announcing expanded capital expenditure plans for data centers and computing infrastructure. And despite the Fed’s cautious messaging, the prospect of rate cuts later in 2026 provides a psychological floor for equity valuations.
E-mini Nasdaq-100: Growth Stocks Face a Technical Test
If the S&P 500’s chart appears constructive, the Nasdaq-100’s presents a more nuanced picture. The technology-heavy index recently broke below an upward-sloping trendline that had contained its advance since December, signaling a potential shift in short-term momentum.
The Nasdaq-100 has been the market’s star performer for much of the post-pandemic era, propelled by investors’ enthusiasm for artificial intelligence, cloud computing, and the digital transformation of commerce. Companies like Nvidia, Microsoft, Apple, Amazon, and Meta Platforms, collectively commanding trillions of dollars in market capitalization, have delivered earnings growth that has justified, at least partially, their elevated valuations.
But the index’s sensitivity to interest rates makes it particularly vulnerable to any reassessment of Fed policy expectations. Growth stocks, by their nature, derive a larger portion of their valuation from earnings expected far into the future. When interest rates rise, the present value of those distant earnings diminishes, pressuring stock prices.
The technical picture shows the Nasdaq-100 futures trading around 25,700, having pulled back from a recent test of the 26,000-to-26,400 all-time high zone. The weekly relative strength index remains above its 50 level, suggesting that the broader uptrend remains intact.
Key support levels for NQ futures lie at 25,250-to-25,300 in the near term, with more significant support at the 24,800-to-25,000 confluence zone(more levels at the end of the post). This deeper support level represents the intersection of daily and weekly demand areas and has significance for longer-term position traders. A sustained break below 24,800 would signal a more substantial correction, potentially targeting the 24,000 area, a decline of roughly 6% from current levels.
The Nasdaq has been remarkably resilient, with pullbacks consistently shallow and short-lived, The question now is whether that pattern holds or whether we’re finally seeing the beginning of a more meaningful correction. I’d watch the 24,800 level closely. If that gives way, you could see a pretty rapid move lower.
Bulls point to the artificial intelligence narrative as a reason for continued optimism. The major cloud computing providers continue to invest aggressively in AI infrastructure, driving demand for advanced semiconductors and related technologies. Third-quarter earnings from Nvidia and other AI beneficiaries exceeded expectations, and fourth-quarter results, due in the coming weeks, are anticipated to show continued strength.
Yet skeptics note that the AI boom has been largely priced into current valuations. For the rally to continue, companies must not merely meet expectations but exceed them by widening margins. In the current environment of cautious capital spending and uncertain end-demand for AI applications, that bar may prove difficult to clear.
Bitcoin’s Sharp Retreat
The Cryptocurrency Stumbles Below $88,000
For much of 2024 and 2025, bitcoin appeared destined to breach the $100,000 level that had assumed almost mythological significance among cryptocurrency enthusiasts. The April 2024 halving, the quadrennial event that reduces the rate at which new bitcoins enter circulation, created supply constraints that, combined with institutional demand through spot exchange-traded funds, drove prices from the $30,000 range in late 2023 to nearly $98,000 by mid-January 2026.
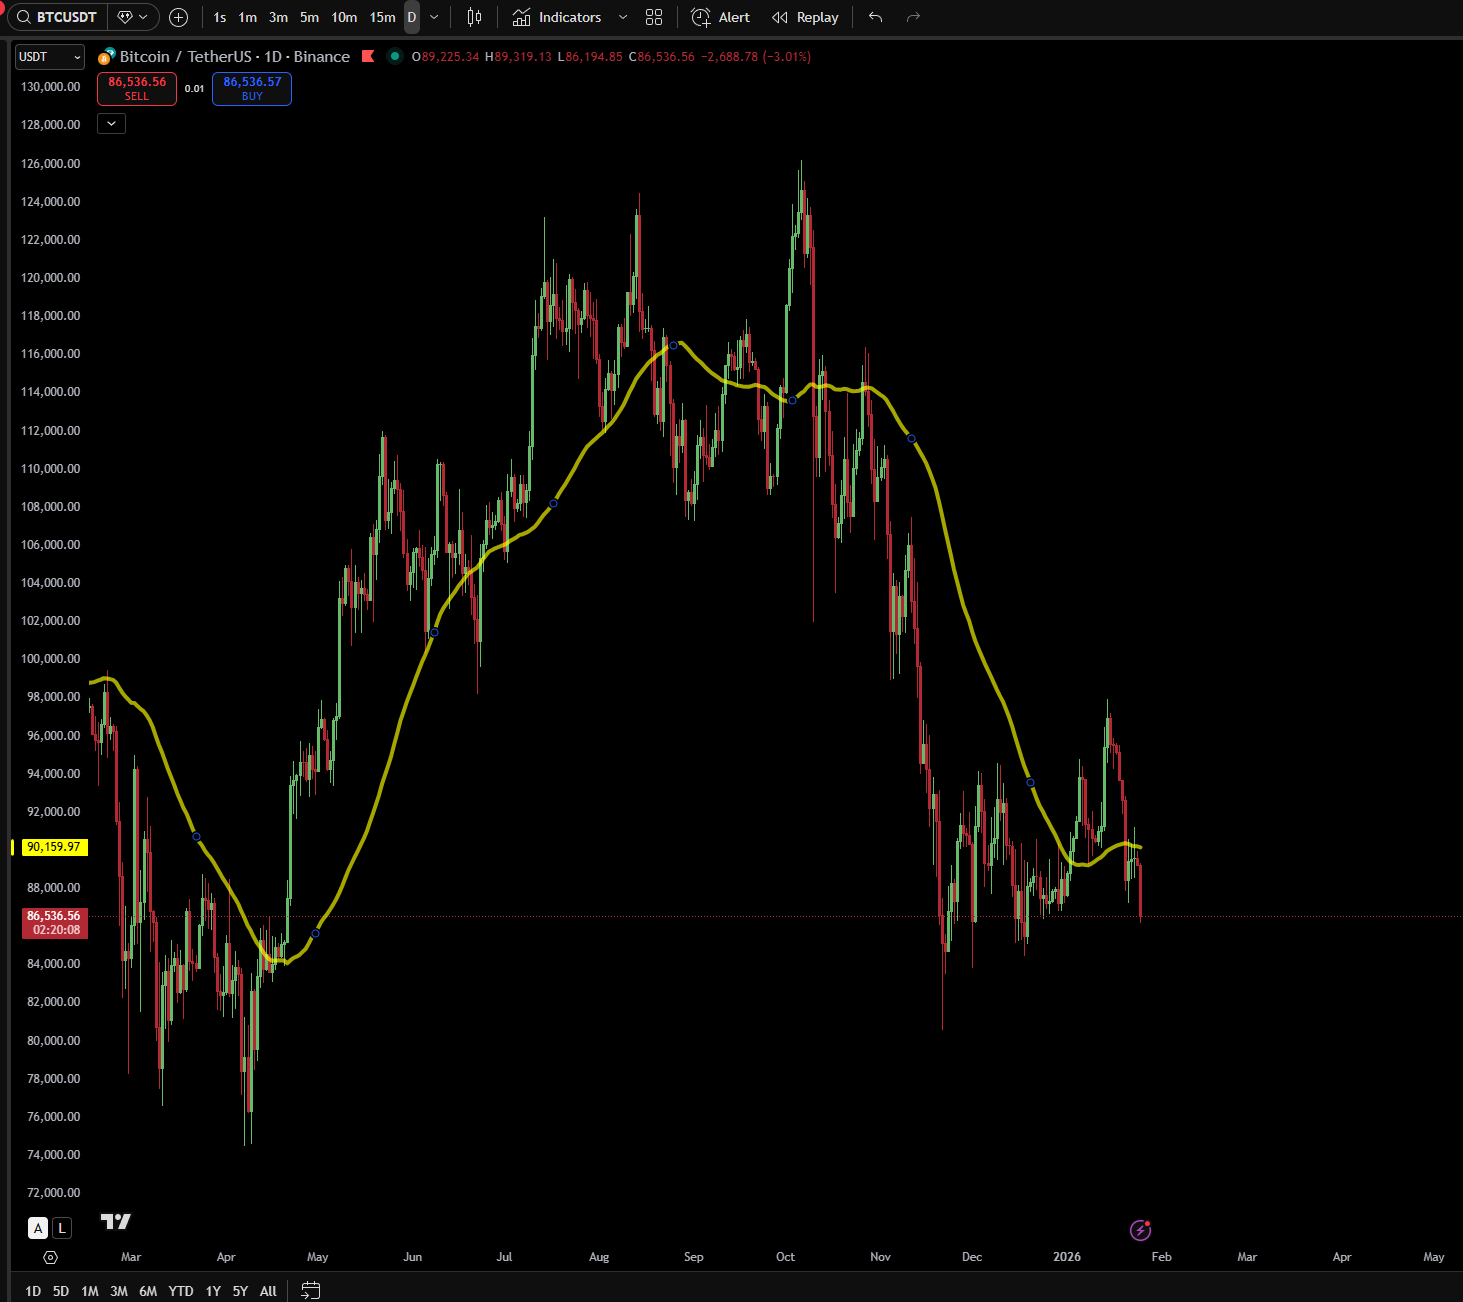
But in late January 2026, the world’s largest cryptocurrency has suffered a sharp retreat that has rattled even seasoned crypto traders. As of January 25, bitcoin trades around $86,700 to $89,000, well below its January 14 high of $97,900 and distressingly far from the psychological $100,000 barrier. The cryptocurrency has lost approximately 7% over the past week alone, triggering over $130 million in leveraged position liquidations as prices dipped below $88,000.
The decline has unfolded with unsettling speed. During the week of January 18, bitcoin pushed past $95,000, reaching its highest level since mid-November 2025 and raising hopes that the long-awaited breach of six figures was finally at hand. But those hopes proved premature. By January 20, prices had slid below $89,000, and the downward pressure has persisted through the weekend.
The psychological significance of $100,000 cannot be overstated. Round numbers exert a powerful influence on market psychology, serving as focal points for both buyers and sellers. Buyers who have been waiting for the right moment to enter may be holding back until prices clear the barrier, viewing $100,000 as validation of bitcoin’s ascent to mainstream acceptance. Sellers, meanwhile, have clustered their orders just below the level, recognizing its significance and seeking to take profits before any potential reversal.
The technical picture has deteriorated notably over the past week. Bitcoin currently trades below a succession of key moving averages, including the 20-day, 50-day, 100-day, and 200-day exponential moving averages, that now serve as overhead resistance levels. The price is struggling at the 50-Week Exponential Moving Average, a level that often determines medium-term trend direction. When prices trade below this indicator, it suggests a weakening of the underlying bull case.
The $88,000-to-$90,000 region has emerged as a stabilization zone, though its durability remains uncertain. A Bollinger Bands squeeze indicates low volatility, typically a precursor to a significant price movement in one direction or the other. The bands have contracted sharply over recent weeks, reflecting the narrow trading range. History suggests that such squeezes resolve with explosive moves, though the direction cannot be predicted from the squeeze alone.
And some technical indicators(not a fan of these but an interesting point), including a bearish “Kumo twist” on the Ichimoku cloud chart, suggest the path of least resistance may be lower. The Ichimoku cloud, a Japanese charting technique that combines multiple indicators into a single visual display, has generated what its practitioners consider a warning signal
Bitcoin is under significant pressure right now. The weekly losses are concerning, and we’re seeing liquidation cascades that suggest overleveraged longs are getting flushed out. The key question is whether the $85,000-$87,000 zone holds as support. If that breaks, we could see a move toward $80,000 or lower.
Institutional Flows and Regulatory Clarity
Two factors loom large in the assessment of bitcoin’s near-term prospects: institutional engagement and regulatory development.
The spot bitcoin ETFs approved in early 2024 transformed the cryptocurrency’s investor base. What was once the exclusive province of retail traders, crypto-native funds, and adventurous family offices became accessible to a far broader array of institutional investors. Pension funds, endowments, and registered investment advisors gained a means to access bitcoin within familiar brokerage accounts, bypassing the complexities of cryptocurrency exchanges and digital wallets.
This democratization of access has been a pillar of bitcoin’s advance. Data on ETF flows suggest consistent net inflows throughout late 2025 and into early 2026, indicative of persistent appetite among professional investors. The leading spot bitcoin ETFs have accumulated billions of dollars in assets, establishing bitcoin as a recognized, if not universally embraced, component of institutional portfolios.
Yet the pace of inflows has moderated from the frenzied levels seen immediately following the ETFs’ launch, suggesting that the initial wave of pent-up institutional demand has been largely satisfied. The “easy money” from institutions that were simply waiting for a regulated vehicle has been made. Further gains will require attracting new buyers, either institutions that remain on the sidelines or incremental allocations from those already invested.
On the regulatory front, proposed U.S. legislation aimed at clarifying the oversight structure for cryptocurrencies has generated cautious optimism. For years, the industry has operated in a regulatory gray zone, with the Securities and Exchange Commission and Commodity Futures Trading Commission staking competing claims to jurisdiction. A legislative framework that resolves these ambiguities could unlock additional institutional capital and reduce the regulatory risk premium embedded in cryptocurrency prices.
“Regulatory clarity would be a game-changer,” said a securities lawyer specializing in digital assets. “Right now, firms are hesitant to allocate meaningfully to crypto because they don’t know what rules they’ll face in two years. If Congress can provide that certainty, you could see a wave of new money flow into the space.”
The Macro Headwinds
Yet bitcoin’s fortunes are not determined solely by crypto-specific factors. As an asset class that thrives on risk appetite and liquidity, bitcoin is acutely sensitive to broader financial conditions, and those conditions have grown more challenging in recent months.
The 10-year Treasury yield, which stood at around 4.00% in early January, has risen to approximately 4.25% as investors have repriced expectations for Fed rate cuts. Higher yields on risk-free government securities increase the opportunity cost of holding non-yielding assets like bitcoin and gold, reducing their relative attractiveness.
This competition for capital is not merely theoretical. Portfolio managers constructing multi-asset portfolios must weigh the expected returns of various asset classes against their risks and correlations. When Treasury yields rise, the hurdle rate for alternative assets like bitcoin increases correspondingly. Why accept the volatility of cryptocurrency when you can earn 4%+ on government bonds?
Meanwhile, the dollar has firmed against major currencies, another headwind for bitcoin and other assets denominated in dollars. A stronger greenback raises the effective cost of bitcoin for international buyers, potentially limiting demand from Europe, Asia, and other regions.
Geopolitical risks present a more complex picture. In theory, bitcoin’s narrative as a stateless, censorship-resistant store of value should benefit from increased global uncertainty. Some analysts have speculated that the cryptocurrency could serve as “digital gold” during periods of crisis, attracting safe-haven flows.
In practice, however, bitcoin has often traded as a risk asset during periods of acute stress. When investors flee risk, bitcoin frequently declines alongside equities, at least in the initial phases of a sell-off. Only later, once the initial panic subsides, has bitcoin sometimes rallied on safe-haven flows.
Price Targets and Probability
Despite the near-term uncertainty, analysts remain broadly bullish on bitcoin’s longer-term trajectory. Major financial institutions have published price targets that cluster in the $150,000-to-$200,000 range for 2026:
Standard Chartered has set a target of $150,000, revised lower from earlier, more aggressive projections but still implying substantial upside from current levels.
Bernstein maintains a $150,000 target, anticipating an elongated bull cycle in which institutional buying offsets retail selling.
JPMorgan estimates a fair value of $170,000 within six to twelve months, based on its model of bitcoin’s evolving role as a portfolio diversifier.
Tom Lee of Fundstrat, a perennial bitcoin bull, has suggested prices could reach $200,000 if macroeconomic conditions align favorably.
Yet prediction markets tell a more cautious story. The odds of bitcoin reclaiming $100,000 in the first half of 2026 are assessed at relatively low levels, reflecting fading short-term momentum following a volatile period in late 2025 and the recent sharp decline in January.
For the week ahead, key levels to monitor include support at $83,000-$85,600 and resistance at the $92,000-$95,000 zone. A decisive break below $85,000 would signal a deepening correction, while a recovery above $92,000 would suggest the recent decline was merely a shakeout of weak hands before another attempt at $100,000.
Crude Oil’s Crosscurrents
Geopolitical Risks Versus Structural Surplus
The crude oil market embodies the tensions that define the current macro environment: geopolitical risks that threaten supply disruptions set against a structural surplus that weighs on prices. For traders in West Texas Intermediate futures, navigating these crosscurrents requires constant vigilance.
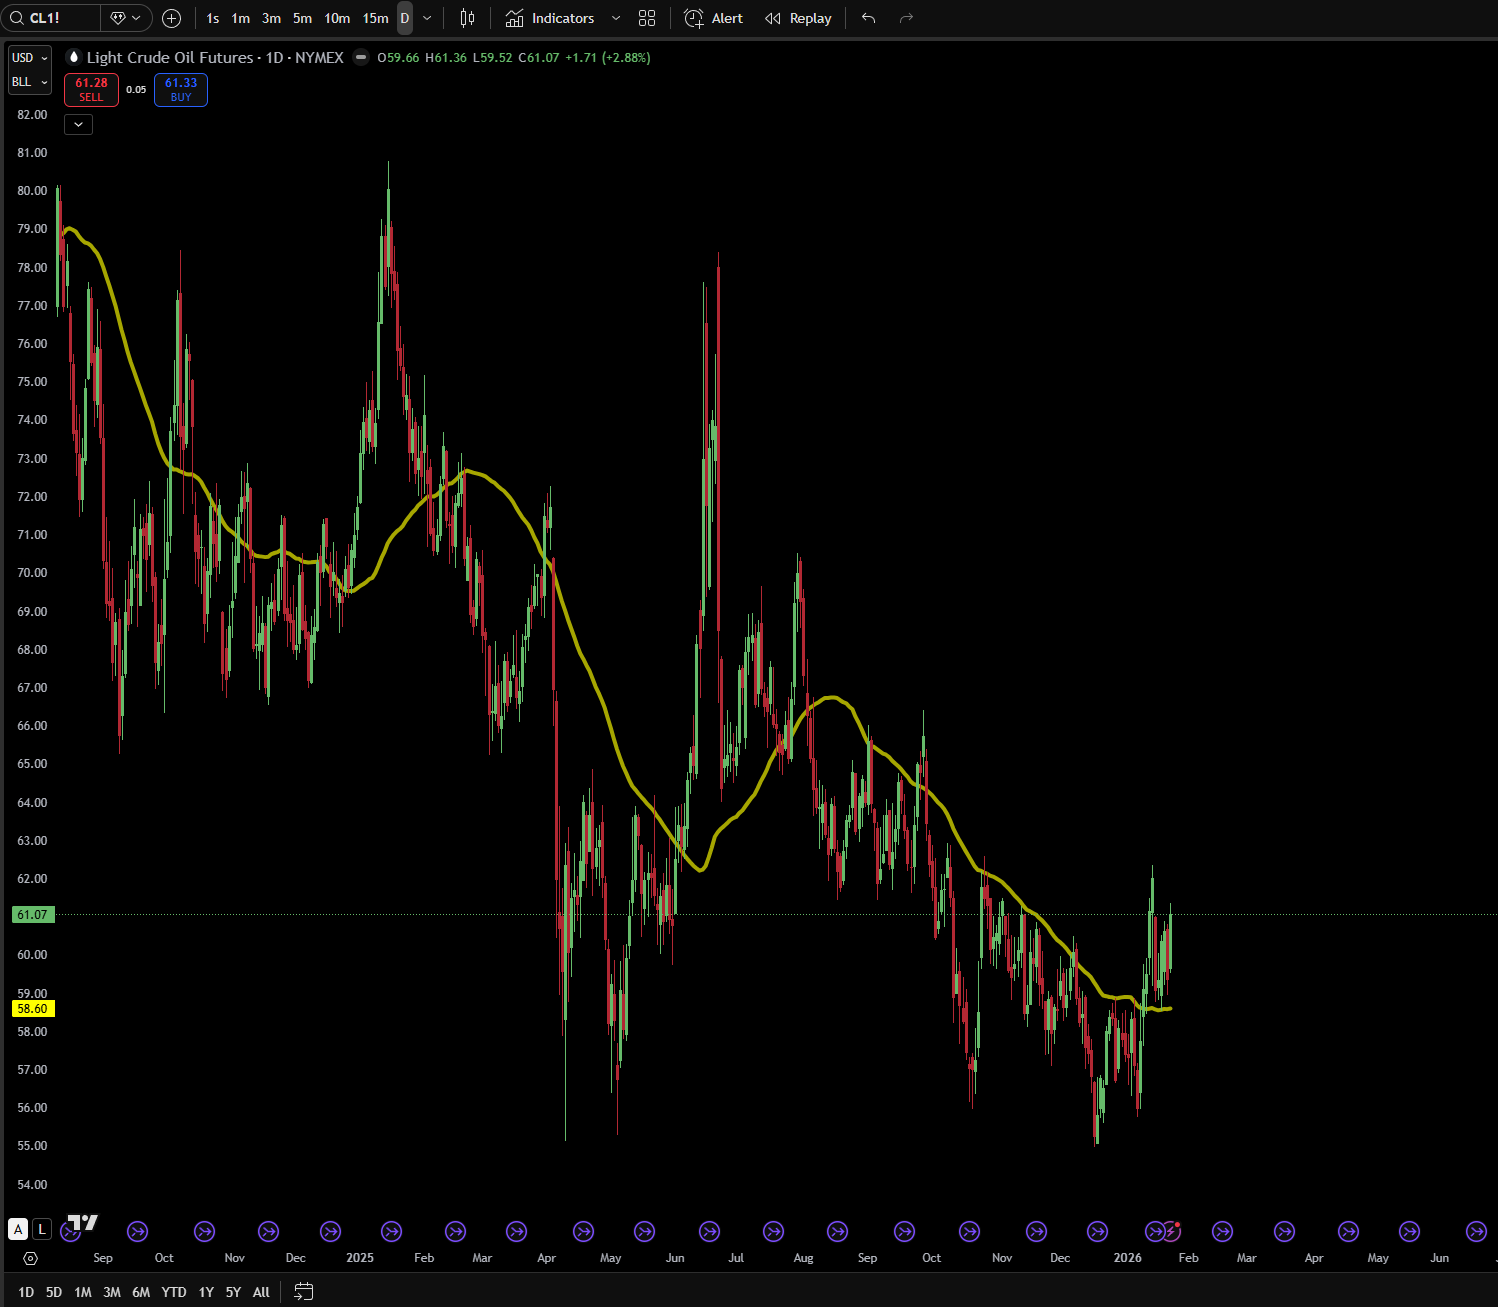
WTI crude opened 2026 near $57.40 per barrel, reflecting its worst annual performance in five years during 2025. The new year brought volatility, with prices touching a low of $55.76 on January 7 before rallying to $62.36 by January 14. As of January 25, WTI trades around $61 per barrel, supported by seasonal winter demand and geopolitical concerns but capped by an impending supply glut.
OPEC+ and the Production Dilemma
The Organization of the Petroleum Exporting Countries and its allies, collectively known as OPEC+, met virtually on January 4 to assess market conditions. The outcome was a reaffirmation of the group’s November 2, 2025, decision to pause production increases through February and March 2026.
This decision reflects OPEC+’s recognition that the market cannot currently absorb additional barrels. The coalition’s strategy throughout 2024 and 2025 has been to restrict supply in an effort to support prices, a tactic that has met with only partial success. While production discipline has prevented a more severe price decline, it has also ceded market share to non-OPEC producers, particularly in the United States.
The next OPEC+ meeting is scheduled for February 1, 2026, when ministers will assess whether to extend the production pause or begin a gradual return of barrels to the market. The outcome will hinge on demand conditions, inventory levels, and, crucially, the trajectory of oil prices in the intervening weeks.
“OPEC+ is in a difficult position. If they bring back production too quickly, prices crash. If they maintain cuts indefinitely, they lose market share and revenue. There’s no easy answer.
The Oversupply Outlook
The U.S. Energy Information Administration’s forecasts paint a challenging picture for oil bulls. The EIA projects that global oil production will exceed demand throughout 2026, leading to inventory builds that could weigh on prices.
The agency’s annual average forecast for WTI in 2026 is $52 per barrel, substantially below current levels and nearly $13 lower than the $65 average in 2025. Global liquid fuels production is anticipated to rise by 1.4 million barrels per day in 2026, with OPEC+ driving a substantial portion of this growth once production increases resume.
Other forecasters have reached similar conclusions. The International Energy Agency has pointed to a potential oversupply of 3.5 million barrels per day in 2026, as current OPEC production levels exceed anticipated demand. A structural surplus of 3 to 4 million barrels per day for the full year would represent a significant shift in market dynamics, pressuring prices toward the lower end of their recent range, or below.
The Geopolitical Risk Premium
Yet crude oil’s price incorporates more than supply-and-demand fundamentals. Geopolitical risk, the premium investors pay for the possibility that conflict could disrupt supply, has proven a persistent feature of the oil market in 2026.
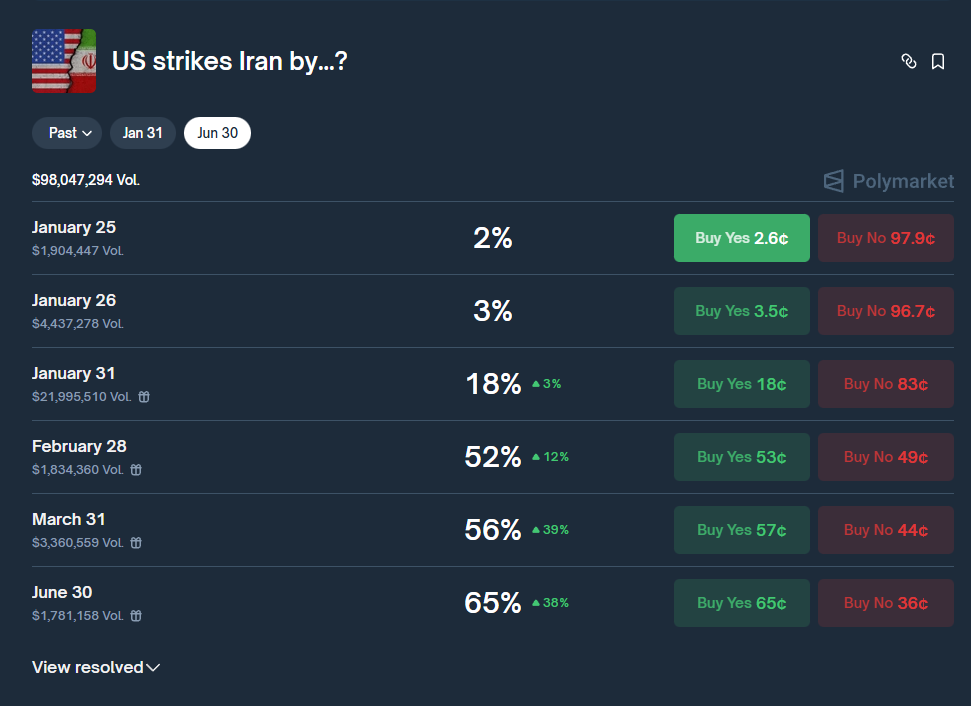
The Middle East remains the primary source of this risk. Tensions between Iran and Israel have escalated throughout January, with reports of widespread protests within Iran, Israeli covert operations aimed at undermining the Iranian regime, and speculation about military strikes against Iranian nuclear facilities. Some analysts have assessed a high probability of a second Israeli-Iranian military conflict in the first quarter of 2026.
President Trump’s administration has added to the uncertainty with its announcement of a 25% tariff on any country that continues trading with Iran, a measure that took effect on January 12. While designed to pressure Iran economically, this policy also creates the potential for supply disruptions if importing nations are forced to seek alternative sources.
The geopolitical risk premium in oil is real, At any moment, a headline could cross that sends prices $5 or $10 higher. The market has to price in that possibility, which puts a floor under prices even when the fundamental outlook is bearish.
For now, these competing forces, geopolitical risk versus structural oversupply, have produced a trading range between $58 and $63 per barrel. A breakout in either direction would require a decisive shift in one of these factors: either a significant escalation of Middle East tensions or a breakthrough in talks that defuses risk, or alternatively a collapse in OPEC+ cohesion or a surprise surge in demand.
Bond Yields and Treasury Market Dynamics
The 10-Year Yield: Anchor of the Financial System
No single financial instrument exerts as much influence on the broader markets as the 10-year U.S. Treasury yield. This benchmark rate serves as the reference point for mortgage rates, corporate borrowing costs, and equity valuation models. Its movements ripple through every asset class, every portfolio, every trading desk on Wall Street.
The 10-year yield has risen from approximately 4.17% two weeks ago to 4.25% as of January 23, a move that, while modest in absolute terms, reflects meaningful repricing of interest rate expectations. The January 12 Treasury auction saw the 10-year note clear at 4.173%, a sign that demand remains solid but that investors are demanding incrementally higher yields to absorb new supply.
The Deficit and Supply Concerns
One factor weighing on Treasury prices, and thus lifting yields, is the sheer volume of debt the U.S. government must issue. Federal budget deficits exceeding $1.5 trillion annually require the Treasury to bring a steady stream of new securities to market. This supply must be absorbed by domestic and foreign buyers, each of whom has alternatives for their capital.
Foreign central banks, once the largest buyers of U.S. Treasuries, have reduced their holdings in recent years. China and Japan, historically the two largest foreign holders, have diversified into other assets, including gold and euro-denominated securities. This shift has placed greater burden on domestic buyers, including insurance companies, pension funds, and mutual funds, to absorb Treasury issuance.
“The supply-demand dynamic in Treasuries has shifted,” explained a fixed-income portfolio manager at a major asset manager. “Ten years ago, you had multiple marginal buyers competing for each bond. Today, the buyer base is narrower, and the deficit is wider. That’s structurally supportive of higher yields.”
Implications for Risk Assets
For equity investors, the 10-year yield’s trajectory matters enormously. Higher yields increase the discount rate applied to future corporate earnings, reducing the present value of stocks, particularly growth stocks with earnings weighted toward future years. At the same time, higher yields make bonds more competitive with equities as an asset class, potentially drawing capital from stock portfolios to bond portfolios.
The relationship between yields and stock prices is not mechanical, however. Equities can advance even as yields rise if the cause of rising yields is strong economic growth rather than inflationary pressure or supply concerns. Context matters.
“The question is why yields are rising,” noted an equity strategist at a global investment bank. “If yields are rising because inflation expectations are becoming unanchored, that’s bad for stocks. If yields are rising because growth is stronger than expected, stocks can handle that. Right now, the answer is ambiguous, which is why markets are uncertain.”
For the week ahead, any movement in the 10-year yield in response to the FOMC announcement or the PPI data will be closely monitored by equity traders seeking to gauge the interest rate environment.
Geopolitical Flashpoints
United States and Iran: Maximum Pressure and Military Posturing
The intensifying confrontation between the United States and Iran represents the most significant geopolitical risk facing markets in early 2026. What began as renewed sanctions has escalated into a full-spectrum pressure campaign that now includes substantial military assets positioned in the Persian Gulf, raising the specter of direct armed conflict between the two nations.
President Trump’s administration has dramatically escalated its “maximum pressure” campaign against Tehran. In January 2026, the Treasury Department’s Office of Foreign Assets Control targeted nine shadow fleet vessels and their owners accused of transporting Iranian oil and petroleum products, with proceeds allegedly funding regional proxies and weapons programs. These actions, implemented under Executive Order 13902, represent the most aggressive sanctions enforcement in years.
Treasury Secretary Scott Bessent has attributed the widespread protests erupting across Iran to the effectiveness of these economic sanctions, claiming they have led to an economic collapse within the country. The collapse of the Iranian rial, shortages of basic goods, and frustration with the ruling establishment have produced the largest demonstrations since the 2022 uprising triggered by the death of Mahsa Amini.
The military dimension of the confrontation has grown equally alarming. President Trump announced the deployment of a major naval flotilla to the region, stating, “We have a big force going toward Iran... Just in case, we have a big flotilla going in that direction.” The USS Abraham Lincoln aircraft carrier, along with destroyers equipped with Tomahawk cruise missiles, has redirected its course toward the Middle East. The U.S. has also dispatched F-15E Strike Eagles to the region to reinforce airpower.
The deployment follows Operation Midnight Hammer in June 2025, when the United States struck Iranian nuclear facilities using B-2 Spirit stealth bombers and Tomahawk missiles. That operation, ordered by President Trump, marked the first direct U.S. military strike on Iranian soil. The January 2026 military buildup suggests Washington is preparing for potential follow-up action or deterrent posturing.
Iran’s response has been defiant and threatening. Supreme Leader Ali Khamenei has reportedly relocated to a fortified underground shelter due to fears of a potential U.S. attack. Iran’s Revolutionary Guard commander has warned that any U.S. military strike would designate all U.S. bases in the region as “legitimate targets.” A mural unveiled in Tehran depicted damaged planes on an aircraft carrier with the message, “If you sow the wind, you will reap the whirlwind.”
Iran has also accelerated its nuclear program in response to international pressure. Reports indicate that uranium enrichment has reached 90%, the level required for weapons-grade material, raising the specter of a nuclear-armed Iran that would fundamentally alter the regional security calculus.
For markets, the implications are severe. Any military exchange between the United States and Iran, particularly one that threatens oil supply from the Persian Gulf or disrupts shipping through the Strait of Hormuz, would send crude prices sharply higher, potentially spiking $10 to $20 per barrel in short order. Safe-haven assets, including gold, the Swiss franc, and potentially the U.S. dollar, would likely appreciate. Equity markets would face significant selling pressure, with defense and energy stocks potentially outperforming the broader indices. The situation remains the most dangerous flashpoint for global markets.
Ukraine and Russia: The War Grinds Forward
The conflict between Ukraine and Russia, now approaching its fourth year, continues to exact a devastating toll on the combatants, on European economies, and on the global supply of food and energy.
Trilateral talks involving the United States, Ukraine, and Russia occurred in Abu Dhabi on January 23-24, with Ukrainian President Volodymyr Zelenskyy describing the discussions as “constructive.” A second round of direct negotiations is anticipated for February 1, raising tentative hopes for a diplomatic resolution.
Yet the military situation suggests that a negotiated settlement remains distant. Russian forces gained 63 square miles of Ukrainian territory between December 23 and January 20, a slower pace than the preceding month but still indicative of continued Russian offensive operations. Moscow’s campaign of long-range missile and drone strikes against Ukraine’s energy infrastructure has severely degraded the power grid; nearly 60% of Kyiv was without electricity by January 21.
Russia has deployed advanced weapons, including the Oreshnik hypersonic missile, which struck Lviv on January 8 and killed four civilians. The use of such weapons signals Moscow’s determination to prosecute the war aggressively regardless of the humanitarian consequences.
For markets, the Ukraine conflict primarily affects European equities and energy markets. Any peace breakthrough would likely trigger a rally in European assets, particularly those most exposed to the war’s disruption of energy supply and trade. Defense stocks globally could face selling pressure if a ceasefire appears imminent.
Conversely, an escalation of the conflict, particularly one that draws NATO forces more directly into hostilities, would have profound implications for risk assets worldwide. While such a scenario remains relatively unlikely, traders routinely monitor headlines from the region for any indication of widening hostilities.
Tariffs and Trade Wars: The Greenland Gambit
President Trump’s trade policy continues to roil markets and strain relationships with traditional allies. The most dramatic development of January has been the threatened imposition of tariffs on European nations unless the United States is permitted to acquire Greenland.
The tariff threat targets Denmark, Norway, Sweden, France, Germany, the Netherlands, Finland, and the United Kingdom, nations with economic ties to Greenland or objections to the American proposal. A 10% tariff was slated to begin on February 1, 2026, escalating to 25% by June 1 if negotiations do not produce an agreement.
European leaders have responded with a mix of incredulity and defiance. The European Union has threatened to activate its Anti-Coercion Instrument, sometimes referred to as the “trade bazooka,” which would allow for broad retaliatory sanctions against U.S. exports. Brussels is also contemplating the reactivation of previously suspended levies on 93 billion euros worth of American goods.
“This is uncharted territory,” observed a trade policy expert at a Washington think tank. “We’ve had trade disputes before, but threatening tariffs over territorial acquisition is something else entirely. It tests the legal and political limits of trade law.”
The broader tariff landscape adds to the uncertainty. The weighted average applied tariff rate on all U.S. imports has reached 14.0%, the highest level since 1946, with an effective tariff rate of 10.1%. These measures represent the largest U.S. tax increase as a percentage of GDP since 1993. A Section 232 investigation into semiconductors resulted in 25% tariffs on specific covered products as of January 15.
For investors, the tariff environment creates headwinds for companies dependent on global supply chains and export markets. Import-dependent retailers and manufacturers face higher input costs, some of which will be passed to consumers in the form of higher prices. Exporters to tariffed regions face retaliatory measures that diminish their competitiveness.
The U.S. Supreme Court’s expected ruling on the president’s authority to impose tariffs under the International Emergency Economic Powers Act could reshape the landscape. If the court constrains that authority, markets would need to reassess the probability of tariff escalation or rollback.
Trade Ideas for the Week Ahead and Weekly Levels
For professional traders seeking to position for the week’s key events, the following trade ideas balance risk and reward across multiple asset classes and scenarios.
