
Weekly Market Outlook 2/1/2026
Bitcoins and pieces

Hello traders,
Hope you all had a great weekend.
A lot happened over the last week and we were on the right side of the markets for the most part.


Realtime Discord access with equity positions tracker(new website rolling out to select subscribers), intraday orderflow & option dealer summaries included with the paid newsletter membership . Click here to subscribe.
Fed Hits Pause Button, but Dissent Signals Debate Within

he Federal Open Market Committee voted 10-2 Wednesday to hold the benchmark federal-funds rate in a range of 3.50% to 3.75%, marking the first pause after three consecutive quarter-point cuts late last year that brought rates down from 4.50%.
The decision was widely expected, but the details provided fodder for both bulls and bears. The committee acknowledged that the labor market remained “low” in terms of job gains and that the unemployment rate had stabilized. On the other hand, the committee noted that inflation remained “somewhat elevated,” signaling that the fight against rising prices was not yet complete.
Governors Christopher Waller and Stephen Miran dissented, arguing for an immediate 25-basis-point reduction. Their opposition underscored a growing rift within the central bank over whether inflation has cooled sufficiently to warrant further easing. Waller, in particular, has been vocal in arguing that the risks of over-tightening now outweigh the risks of doing too little on inflation.
The dissents were the story. Waller is not a dove by nature. When he starts pushing for cuts, it deserves attention.
In its post-meeting statement, the Fed emphasized its commitment to assessing incoming data when considering future adjustments. This language was interpreted as leaving the door open to a cut as early as March, though market pricing suggests June or September is more likely.
The market reaction was muted but modestly positive. Equities rallied into the close, bond yields ticked lower, and the dollar weakened slightly. Fed funds futures shifted to price in slightly higher odds of a cut by mid-year, with the probability rising from around 40% before the meeting to roughly 50% afterward.
For now, the Fed’s message is one of patience. The committee is in no hurry to move in either direction, preferring to let the data guide its decisions.
Take advantage of APEX’s 90% promo code and pass account in one day. Also $40 resets on your accounts. Use code ALGO or alternatively just click the button below
Commodities: A Month for the History Books
If January 2026 will be remembered for anything in financial markets, it may well be the historic surge in precious metals and the resurgence of crude oil. Safe-haven demand, a plummeting dollar, and geopolitical anxiety combined to produce some of the most dramatic moves in commodity markets in decades.
Gold Rallies to Record Highs Before Pullback
Gold delivered a historic monthly performance, surging to an all-time high of $5,626.3 before profit-taking drove a steep correction.
The yellow metal opened January around $4,330 and spent the month in a parabolic ascent, breaking above $5,000, then $5,200, then $5,400, before peaking at $5,608.35, a gain of nearly 30% at its peak. The move represented one of the largest monthly rallies in gold’s modern history.
Gold Futures closed January 30 at $4,763.10, a stunning correction from the highs but still up roughly 10% for the month.
The rally was fueled by converging forces:
Central bank buying: World Gold Council data shows official sector purchases exceeded 1,000 tonnes for the third consecutive year, with China, India, Turkey, and Poland leading
Dollar weakness: The DXY fell sharply as Fed cut expectations rose
Iran tensions: The escalating nuclear standoff drove safe-haven demand to extreme levels
Inflation hedge: With tariffs threatening renewed price pressures, gold attracted fresh positioning
The correction came on January 30 as traders booked profits and uncertainty emerged around potential Fed personnel changes. The move was exacerbated by margin calls on leveraged positions.
J.P. Morgan projects gold will average $5,055 per ounce by Q4 2026. Goldman Sachs raised its 2026 target to $5,400. The most bullish forecasters see $6,000+ if geopolitical tensions escalate to open conflict.
Gold Trade Idea
The pullback from $5,608 to $4,763 (down 15%) creates a buying opportunity for those who missed the initial surge. Fundamentals remain intact.
Setup: GC Long on Support Test
Entry: $4,700 to $4,800 zone
Stop Loss: $4,550 (below the 50-day MA)
Target 1: $5,200 (prior resistance becomes support)
Target 2: $5,600 (retest of all-time high)
Target 3: $6,000 (extension)
Risk-Reward: 1:3
Conservative Entry:
Wait for daily close above $5,000
Entry: $5,020
Stop Loss: $4,800
Target: $5,600+
Rationale: Confirms buyers have absorbed the correction
Options Play: GLD Call Spread
Buy GLD March $435call
Sell GLD March $460 call
Defined risk, leveraged exposure to gold rally
NB: These are setups and not trades. For more details, please check the discord.
Silver Suffers Violent Correction After Parabolic Run
ilver’s January was extraordinary, one of the most volatile months in the metal’s trading history.
Silver exploded higher through mid-January, driven by industrial demand from AI infrastructure, solar panels, and electric vehicles, combined with safe-haven buying spillover from gold. The white metal surged from roughly $32 at the start of January to an all-time high of $121.67, a gain of nearly 280% at its peak.
Citigroup dubbed it “gold on steroids” and forecast $150 within three months. Chinese buying was relentless as industrial users scrambled to secure physical metal. Major miners like Fresnillo and Hecla revised production guidance lower, and the structural supply deficit asserted itself violently.
But the rally ended in catastrophe. On January 29, the CME Group implemented a new percentage-based margin system that hiked maintenance margins to 16.5% of contract value. The move forced leveraged speculators to liquidate en masse.
The result was a cascade crash. Silver plummeted from above $100 to as low as $75 in a matter of hours. Silver closed Friday, January 31 at $78.53, down 35% from the all-time high in just two days.
The crash wiped out billions in speculative profits and reminded traders why silver is called “the devil’s trade.”
Silver Trade Idea
Silver’s close at $78.53 after the crash from $121.67 creates both danger and opportunity. Only traders comfortable with extreme volatility should participate. Position sizing must be significantly reduced.
Setup: SI Long at Crash Support
Entry: $70 to $72 zone (current area)
Stop Loss: $64 (below the crash low with buffer)
Target 1: $95 (50% retracement)
Target 2: $110 (61.8% retracement)
Target 3: $120+ (retest of highs)
Risk-Reward: 1:3
Position Size: 25% of normal due to volatility
Aggressive Breakout Setup:
Entry: $88 on daily close above $85 with volume
Stop Loss: $78
Target: $110+
Rationale: Reclaim of $85 signals liquidation is over
Conservative Play: Silver Miners (SIL)
Entry: Current levels
Stop Loss: 15% below entry
Target: 40% to 60% upside if silver recovers
Rationale: Leveraged silver exposure without margin risk
NB: These are setups and not trades. For more details, please check the discord.
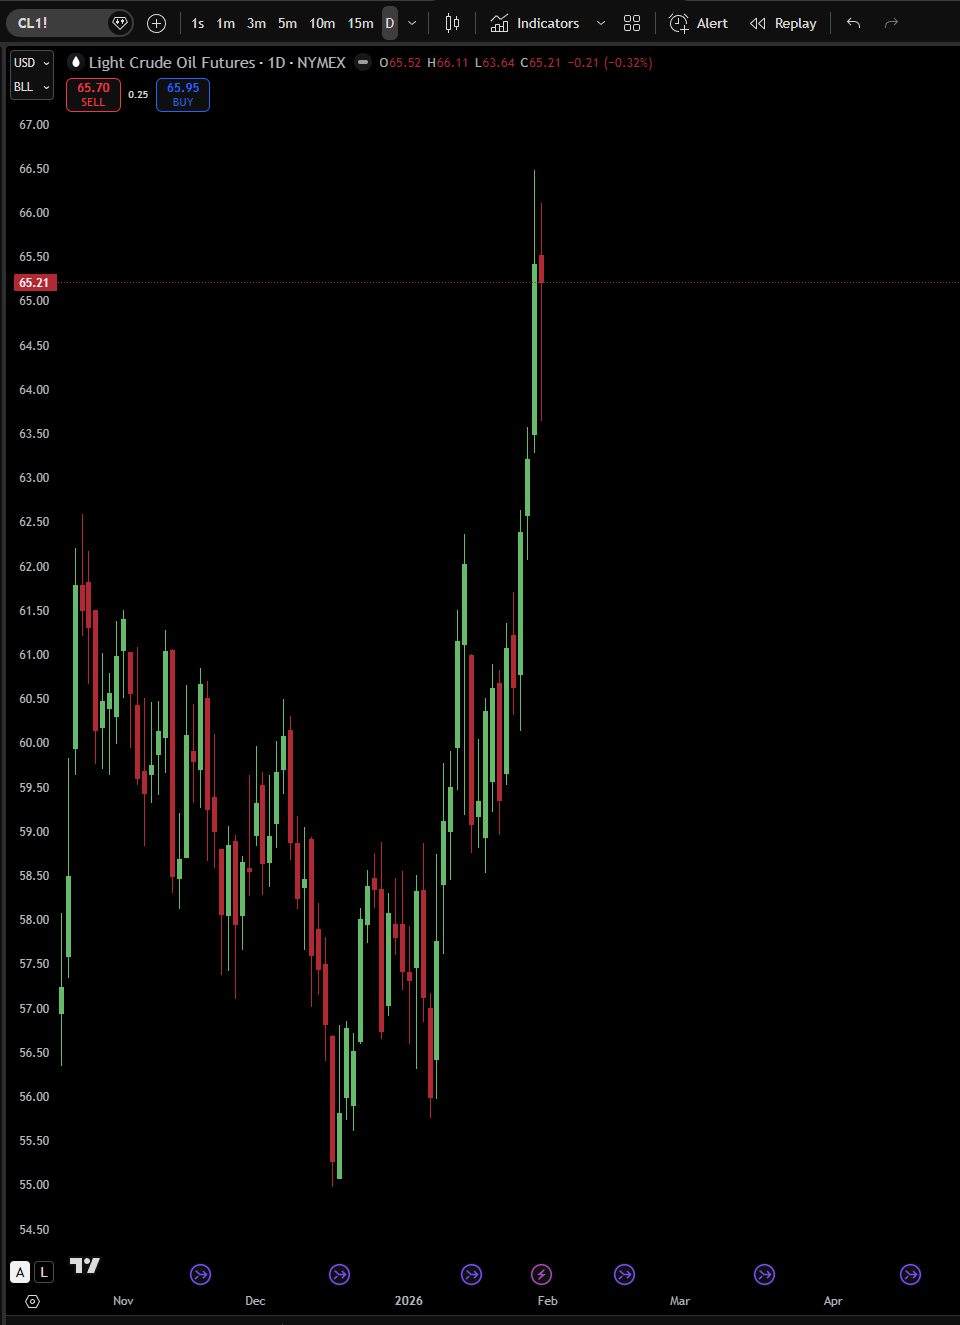
Crude Oil Posts Best Month Since 2023
West Texas Intermediate futures surged 13.57% in January, their strongest monthly performance since July 2023, as tensions between Washington and Tehran ratcheted higher.
The rally came as the Trump administration warned of potential military action if Iran’s nuclear program advances further. Intelligence reports indicating Iran has enriched uranium to 90% purity, the threshold for weapons-grade material, sent traders scrambling for protection.
“The Strait of Hormuz risk premium is back in a big way,” said an energy analyst at a major commodities desk. “Add in supply disruptions from Kazakhstan, winter freeze-offs in the Permian, and tighter sanctions on Russian crude, and you’ve got a perfect storm for bulls.”
Production outages proved particularly supportive. Kazakhstan experienced unexpected shutdowns, winter storms triggered freeze-offs across the Permian Basin, and tighter restrictions on Russian oil purchases finally began to bite.
The International Energy Agency raised its global demand forecast for 2026 to 930,000 barrels a day, citing improving economic conditions. But not everyone is convinced the rally has legs. The U.S. Energy Information Administration still projects WTI averaging just $52 this year as global supply outpaces consumption.
OPEC ministers gather Monday, their first meeting since the January surge, and any signals on production quotas could set the tone for February.
Key levels to watch:
