
Weekly Market Outlook 7/27/2025
ART OF THE DEAL

Hello traders,
Big news over the weekend has been that a tariff deal has been announced with the EU and another 90 day extension has been achieved with China.
You can jump to the Outlook and Weekly levels by clicking on them directly.
NEW: AUDIO SUMMARY OF THIS ARTICLE HERE, CLICK ON PLAY FOR THOSE WHO DO NOT LIKE TO READ.
But first,
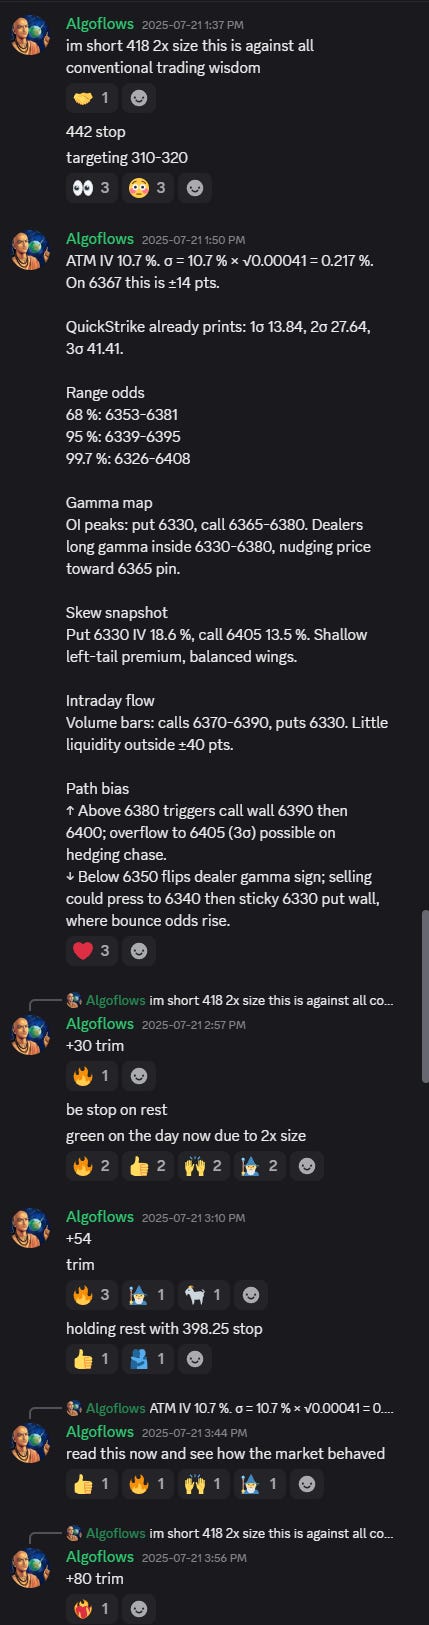
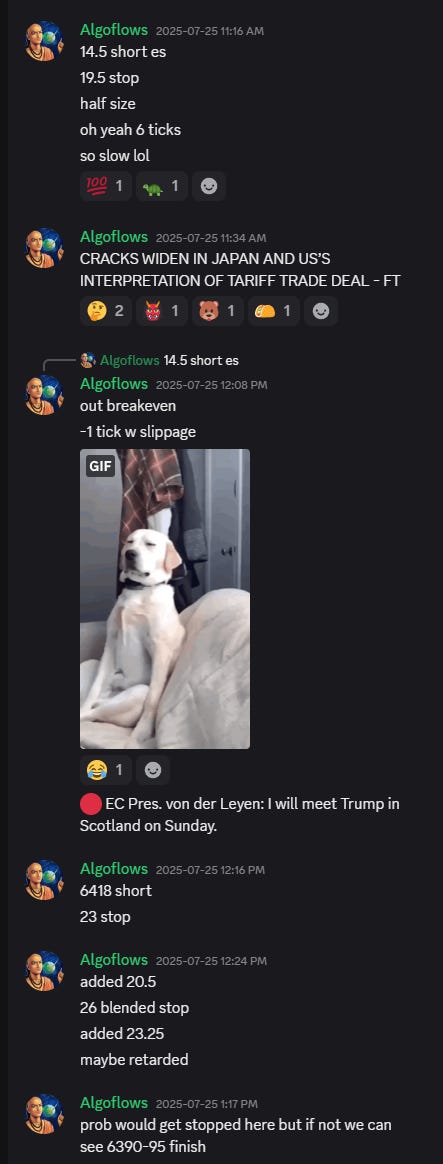
Let us recap last week’s trade ideas.
90% of this plan is free and only the weekly levels are paywalled. Realtime Discord access with intraday orderflow & option dealer summaries included with the paid newsletter membership . Click here to subscribe.

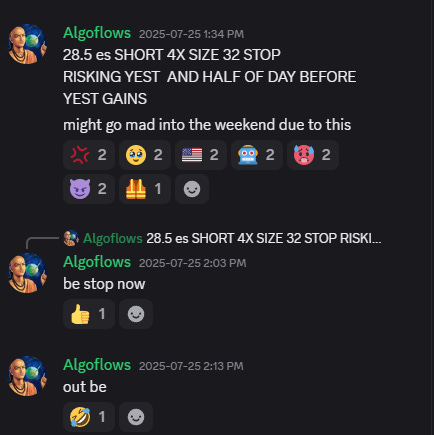
Friday was a red day for me but if I had held on to the short and not chickened out would have paid handsomely, we live & we learn.
Turnberry Accord and Beyond: Navigating a Market at the Crossroads of Tariffs, Policy, and Conflict
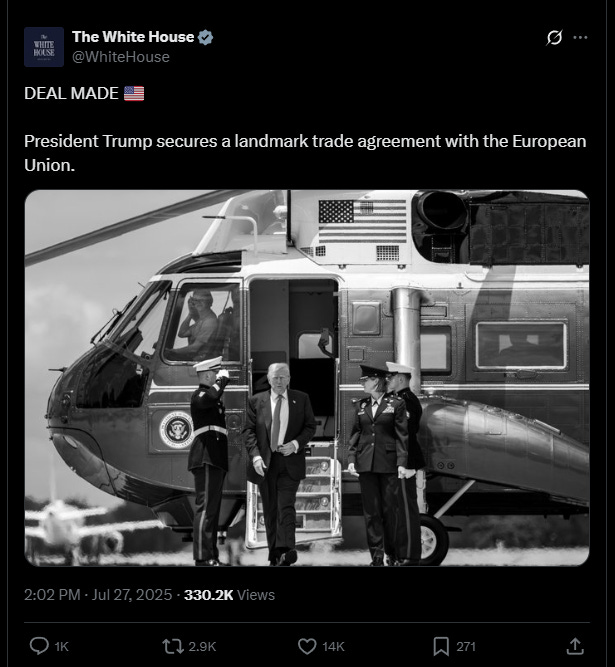
Global trading rules have mutated. A last‑minute bargain between Washington and Brussels kept a 30 percent tariff cliff from detonating, yet it locked in a permanent 15 percent floor that redefines “normal” commerce. Equity indices cheered, credit stayed cautious, and the Treasury curve refused to uninvert. Simultaneously, the China truce merely extends a ticking clock. The Federal Reserve now faces inflation seeded by policy itself. Geopolitical hot spots – Iran–Israel after June’s missile exchange and Russia–Ukraine’s grinding front – lurk in the background of every commodity chart. The week beginning 28 July is loaded: FOMC, Q2 GDP advance, Core PCE, and payrolls will test the gap between optimism and macro reality. A fragile rally in ES and NQ, a consolidation in Bitcoin around record highs, and a coiled WTI range all hinge on whether policymakers underscore or undercut the market’s relief narrative.
1. The New Trade Regime
1.1 Institutionalized Protection
Pre‑2025 globalism is over. The Turnberry Accord codifies a 15 percent baseline on most EU exports to the United States. Pharmaceuticals are spared, while 50 percent tariffs on steel and aluminum persist. German automakers dodge a lethal 30 percent threat but now live with an expensive new “normal.” The EU pledged to absorb 750 billion USD of American energy and funnel 600 billion into stateside investment. These numbers stretch credulity yet signal a geopolitical dowry: Brussels aligns supply chains and security budgets closer to Washington to hedge against Moscow and Beijing.
1.2 Growth Drag and Price Floor
Tariffs are an inflationary tax. Yale Budget Lab calculates the blended U.S. consumer tariff at 20.2 percent, the loftiest since 1911. The lab’s model pegs a 0.8 percentage‑point haircut to 2025 real GDP and a 2 700 USD hit to household income. Footwear, apparel, and autos absorb the worst pass‑through: shoes up 40 percent, clothing 36 percent, an average new car 6 300 USD dearer. The shift is not cyclical but structural. Supply chains re‑route, working capital swells, and pricing power migrates upstream. The equity market discounts the drag; the bond market does not.
1.3 The China Pause
Stockholm negotiations extended a 10 percent base rate on Chinese imports for ninety days, deferring a jump to 34 percent. No real concessions surfaced. Washington wants Beijing to curb industrial overcapacity and fentanyl precursors. Beijing wants tariff removal. Both want time. The extension eliminates a headline shock but freezes a high‑friction status quo that crimps margins and capex planning. Corporates pay in silence while indices celebrate the absence of fresh pain.
2. Monetary Policy Crosscurrents
2.1 FOMC Tightrope
Consensus expects the Federal funds target to hold at 4.25–4.50 percent for a fifth meeting. Core CPI sits at 2.9 percent year‑over‑year, above target and sticky. Beige Book anecdotes flag tariff‑driven cost push. The White House lobbies for cuts ahead of the 2026 campaign cycle and even hints at replacing Chair Powell. The Committee must defend credibility without triggering disorderly tightening in financial conditions.
Communication risk: A single statement line that implies “tariffs lift inflation expectations” can re‑price the entire path of cuts now priced at 69 percent odds for September.
Historical echo: The 2018 “Powell Pivot” shows how quickly the Committee can whipsaw risk assets, but 2025 inflation gives it less room for dovish theatrics.
2.2 Treasury Curve Signal
Ten‑year yields hover near 4.39 percent while three‑month bills flirt with the same level, leaving the 10y‑3m spread synchronous or negative. Eleven months of inversion preceded every post‑1965 recession save one. Demand at recent auctions stayed healthy. Buyers use 4 handle coupons as insurance, not optimism.
3. Sentiment Dashboard – 25 July Snapshot
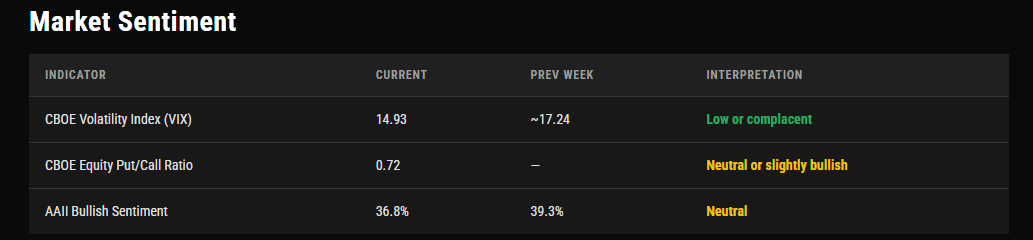
Optimism exists, but not the kind that survives a policy shock unhedged.
4. Geopolitics: Latent Volatility
4.1 Iran and Israel – Post‑War Equilibrium
June’s 12‑day exchange proved direct state‑on‑state attacks no longer taboo. Israeli strikes delayed the Iranian nuclear program by months, not years. Tehran’s missile salvos pierced Israel’s Iron Dome in several places, exposing tactical vulnerabilities. The ceasefire holds amid shuttle diplomacy, yet the strategic calculus remains unchanged: Israel will pre‑empt if enrichment accelerates, Iran will retaliate asymmetrically. WTI’s spike to 79 USD and full retrace to 65 USD demonstrates collective amnesia. The next headline could re‑price barrels by double digits overnight.
4.2 Ukraine Frontline
Russian forces occupy about one‑fifth of Ukraine. Artillery duels eat manpower, shells, and Western reserves. Moscow now targets mobilization centers to slow Kyiv’s rotation. NATO aid continues yet slows as U.S. budget politics bleed into election season. Grain corridors remain vulnerable. Any blockade rumor amplifies food CPI and emerging‑market balance‑of‑payments stress.
5. Asset‑Class Deep Dive
5.1 Equities – ES and NQ
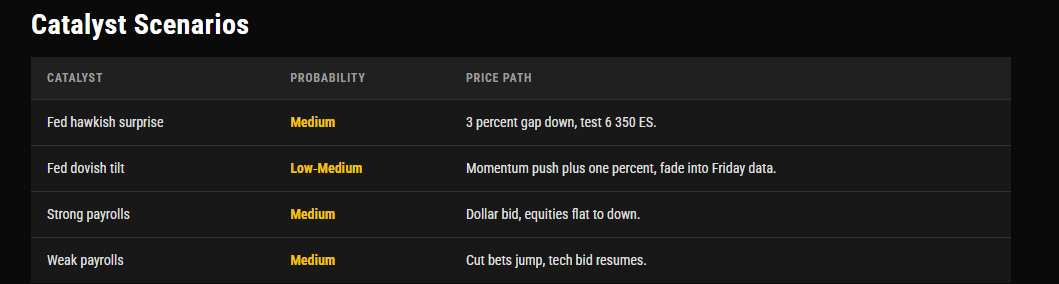
ESU25 prints 6 425 all‑time highs. Immediate support: 6400 then 6 350. Overextension begs mean reversion but the market gods can be irrational longer than you can say “Oh Shit I blew up”.
NQU25 prints 23 421. Leaderboard driven by semis and cloud. Support: 23 200 then 23 000. A runaway gap at 20 500 still maps to 25 000 measured move if earnings hold.
Scenario Matrix
5.2 Bitcoin
Spot trades 118 000 USD inside a 115 000–122 500 rectangle. ETF flows totaled 54.6 billion net. A daily close above 122 500 targets 128 000 then 130 000. Break below 114 500 invites 110 000. Correlation with NQ stays near 0.77 six‑month rolling. Macro designation confirmed.
5.3 Crude Oil – WTI September
Range 65.00 support to 69.20 resistance. 200‑day MA sits near 68.50. Dollar strength plus growth worries cap rallies. Middle East shock is asymmetric upside. Calendar spreads flattened post‑war, signaling adequate near‑term supply, yet any Iranian export disruption flips curves to backwardation.
6. Trade Frameworks
Tactical Short post‑FOMC
Entry: If ES fails to hold post‑announcement spike and slips beneath pre‑FOMC level.
Stop: Above spike high.
Target: 6350 ES or 23100 NQ.
Pullback Long
Wait for ES 6360–6380 basing with evidence of buyers in tape. Align with prevailing uptrend unless policy shock invalidates thesis.
Bitcoin Breakout
Trigger: Daily close north of 122500.
Stop: 114500.
First target: 128000.
WTI Range Fade
Sell 68.00–68.50 with stop at 69.40. Cover near 66.00. Prepare for breakout either side.
7. Structural Themes to Monitor
Supply Chain Rewiring – Multinationals pivot toward regional hubs. Capex tilts to Mexico, Vietnam, and U.S. Sun Belt. Watch ISM supplier delivery indices.
Energy Security as Foreign Policy – EU’s pledge ties its gas market to U.S. LNG logistics. Spaniard and French regasification capacity expansions become hidden tariffs on Russian influence.
Fiscal‑Monetary Collision – Tariff revenue feeds populist spending that raises deficit and bond supply, forcing the Fed to remain vigilant.
Central Bank Independence Stress – Political commentary about removing Powell chips at expectations anchor. Similar pressure echoes in Europe, where hawks at the ECB confront recessive data.
Dollar Smile Revival – Tariffs, higher yields, and geopolitical demand for safety keep USD bid against G10 ex‑safe havens, tightening global financial conditions.
8. Market Sentience versus Reality
Equities extrapolate corporate earnings beats forward, ignoring margin compression from tariff‑inflated input costs. Bonds signal caution. The spread cannot persist for long. Either growth data rebound and justify valuations, or the equity curve bends toward the bond curve. The FOMC and July macro releases will start that reconciliation.
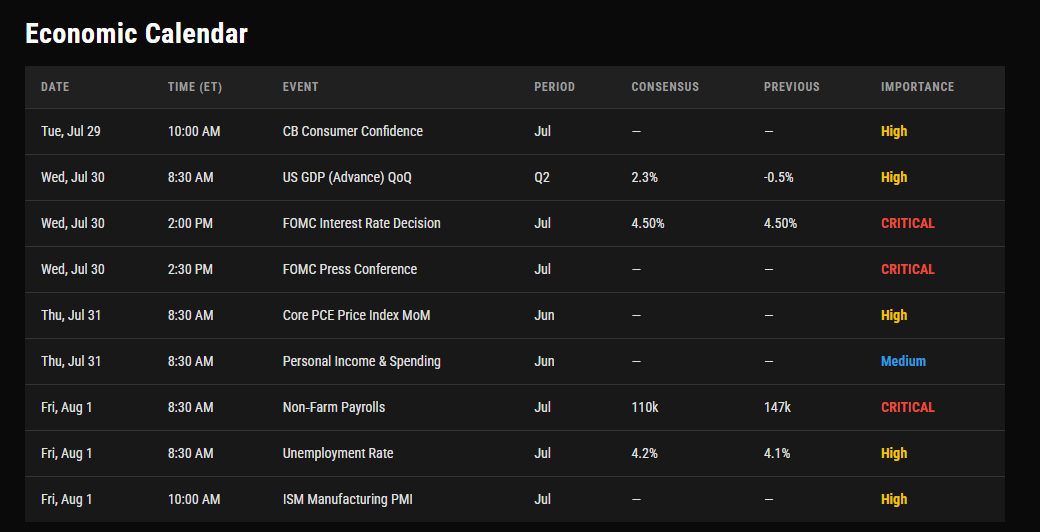
Weekly Calendar

Weekly Levels
Subscribers are urged to use the tradingview indicator to plot the levels.
NOTE: SUBSCRIBERS ARE URGED TO JOIN THE DISCORD AT THEIR EARLIEST CONVENIENCE.
