
Weekly Market Outlook 8/3/2025
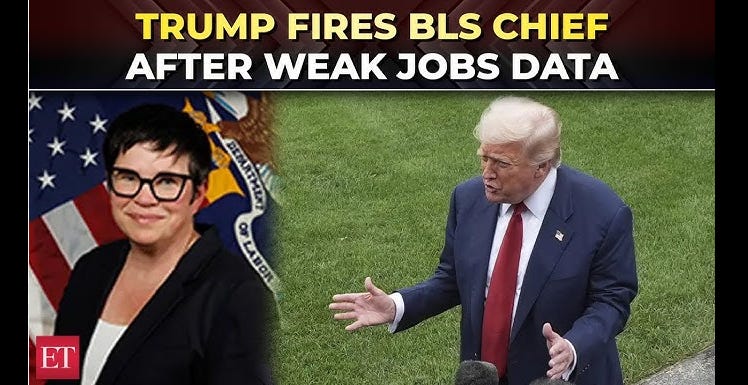
Bureau of Lying Statistics

Hello traders,
I hope you all had a great weekend and got some time off screens.
Last week we finally got some volatility after the Powell Presser.
You can jump to the Outlook and Weekly levels by clicking on them directly.
NEW: AUDIO SUMMARY OF THIS ARTICLE HERE, CLICK ON PLAY FOR THOSE WHO DO NOT LIKE TO READ.
Let us recap last week’s trade larger timeframe ideas.
AlgoFlows’s Newsletter is a reader-supported publication. To receive new posts and support my work, consider becoming a free or paid subscriber.
90% of this plan is free and only the weekly levels are paywalled. Realtime Discord access with intraday orderflow & option dealer summaries included with the paid newsletter membership . Click here to subscribe.
Markets Buckle as Tariff Pacts and Weakening Labor Data Fuel Recession Fears
A New World for Trade: Landmark Tariff Deals Mask Deepening Economic Anxiety
The past week marked a watershed moment in global trade, as the White House finalized a sweeping new framework with key partners. While these agreements were hailed as diplomatic triumphs that avoided a catastrophic trade war, financial markets interpreted them not as de-escalation but as the formalization of a more costly, uncertain, and inflationary world. A week that began with a relief rally on the back of a landmark U.S.-European Union agreement ended in a rout, as investors digested the stark reality that the new baseline for global commerce is one of structurally higher prices and slower growth. This emerging stagflationary impulse complicates every facet of the market, from corporate profit outlooks to the increasingly fraught policy decisions facing the world's central banks.
The US-EU "Deal": A Pyrrhic Victory?
Over the preceding weekend, the United States and the European Union announced a framework agreement narrowly dodging President Donald Trump's threat to impose tariffs of 30% or higher on European goods beginning August 1. The deal establishes a new, all-inclusive tariff ceiling of 15% on the vast majority of EU exports to the U.S., including critical sectors like automobiles and auto parts, which had faced levies as high as 25%. In return, the White House secured significant commitments from Brussels, including pledges for the EU to purchase $750 billion in American energy products and facilitate $600 billion in new investments into the U.S. by 2028.
The agreement also features strategic carve-outs, establishing "zero-for-zero" tariffs on goods deemed critical, such as aircraft and component parts, certain chemicals, and some generic drugs. This provision was lauded by the aerospace industry, celebrating the restoration of a level playing field that has been in place for decades. U.S. officials praised the deal as a generational modernization of the transatlantic alliance that would bolster American manufacturing and reduce the trade deficit.
However, the market's initial optimism represented a fundamental misreading of the new landscape. The brief relief rally was predicated on avoiding the worst-case scenario of a 30% tariff wall, a tail risk that had been hanging over markets for months. Once that immediate threat was removed, a deeper and more troubling reality set in. The new 15% baseline, while better than 30%, represents a monumental shift from the pre-existing average tariff on EU goods, which stood at a mere 1.2% last year. This is not a return to the status quo; it is the codification of a new protectionist world order. The very structure of the deal is inherently stagflationary, acting as a direct shock to the global economy. It is designed to slow economic growth by raising input costs for businesses and prices for consumers—one estimate suggests the new tariff regime will reduce the EU's gross domestic product by 0.5%. Simultaneously, these higher costs are inflationary, injecting price pressures into the system at a time when central banks are already struggling to return inflation to their targets. This creates an unavoidable policy conflict for both the Federal Reserve and the European Central Bank, severely limiting their ability to combat an economic slowdown with monetary easing. The very deal lauded by Washington as a victory is the source of the economic malaise that will ultimately force the Federal Reserve's hand.
The US-China Standoff: An Uneasy Truce on the Brink
While the trans-Atlantic trade picture gained clarity, however unwelcome, the situation with China descended into deeper uncertainty. Two days of high-level talks in Stockholm between U.S. Treasury Secretary Scott Bessent and Chinese Vice Premier He Lifeng concluded without a definitive agreement to extend the August 12 deadline for the current tariff pause. Under the temporary truce, U.S. tariffs on Chinese goods stand at 30%, while China imposes a 10% duty on American products—rates that are punishing but far below the triple-digit, embargo-like levels that sent markets into a tailspin in April.
The lack of a formal extension is not a neutral outcome; it is a distinctly negative one for markets and global businesses. The inconclusive talks force corporations to operate under the assumption that tariffs could "boomerang" back to catastrophic levels after the August 12 deadline. This profound uncertainty acts as a powerful brake on investment, expansion, and hiring—a dynamic reflected in the week's dismal U.S. labor market data. The market is now trapped between the fading hope of an eleventh-hour extension and the grim reality of a looming deadline that threatens to reignite the most damaging front of the global trade war.
Complicating matters further, the negotiations have evolved beyond purely economic disputes. A primary point of contention in the Stockholm talks was the U.S. objection to China's continued purchases of Russian oil and gas, with American officials explicitly threatening more tariffs if Beijing does not curtail its energy relationship with Moscow. This development confirms that U.S. trade policy has become fully intertwined with broader foreign policy objectives, particularly concerning the Russia-Ukraine conflict. The path to resolution is no longer a simple economic calculation of trade deficits and market access. It has transformed into a multi-polar geopolitical chess match, where decisions are influenced by strategic alliances and national security concerns, dramatically increasing the risk of miscalculation with severe economic consequences.
From Record Highs to a Rout: A Brutal Weekly Reversal for Risk Assets
The week's trading action unfolded like a classic bull trap, luring investors toward new heights before a violent rejection. Markets, buoyed by strong corporate earnings reports from the technology sector, climbed to all-time highs, seemingly oblivious to the brewing macroeconomic storm. But the facade of strength crumbled spectacularly as the reality of stagflationary trade policy and a rapidly deteriorating labor market took hold, triggering a brutal reversal that sent a chill through global risk assets.
The Ascent
The week began on a positive note, with both the S&P 500 and the Nasdaq-100 building on the previous week's gains. By Thursday, both benchmark indices had notched fresh all-time highs, driven largely by stellar quarterly results from technology behemoths Microsoft and Meta. Their performance seemed to reinforce the prevailing market narrative that the broader Q2 earnings season was strong enough to power stocks higher. Across the S&P 500, of the 329 companies that had reported by week's end, 82% had beaten earnings-per-share estimates, with revenue growth tracking at a healthy 5.88% year-over-year. For months, the consensus view held that the sheer earnings power of the market's largest companies could carry the indices through any macroeconomic turbulence.
The Collapse
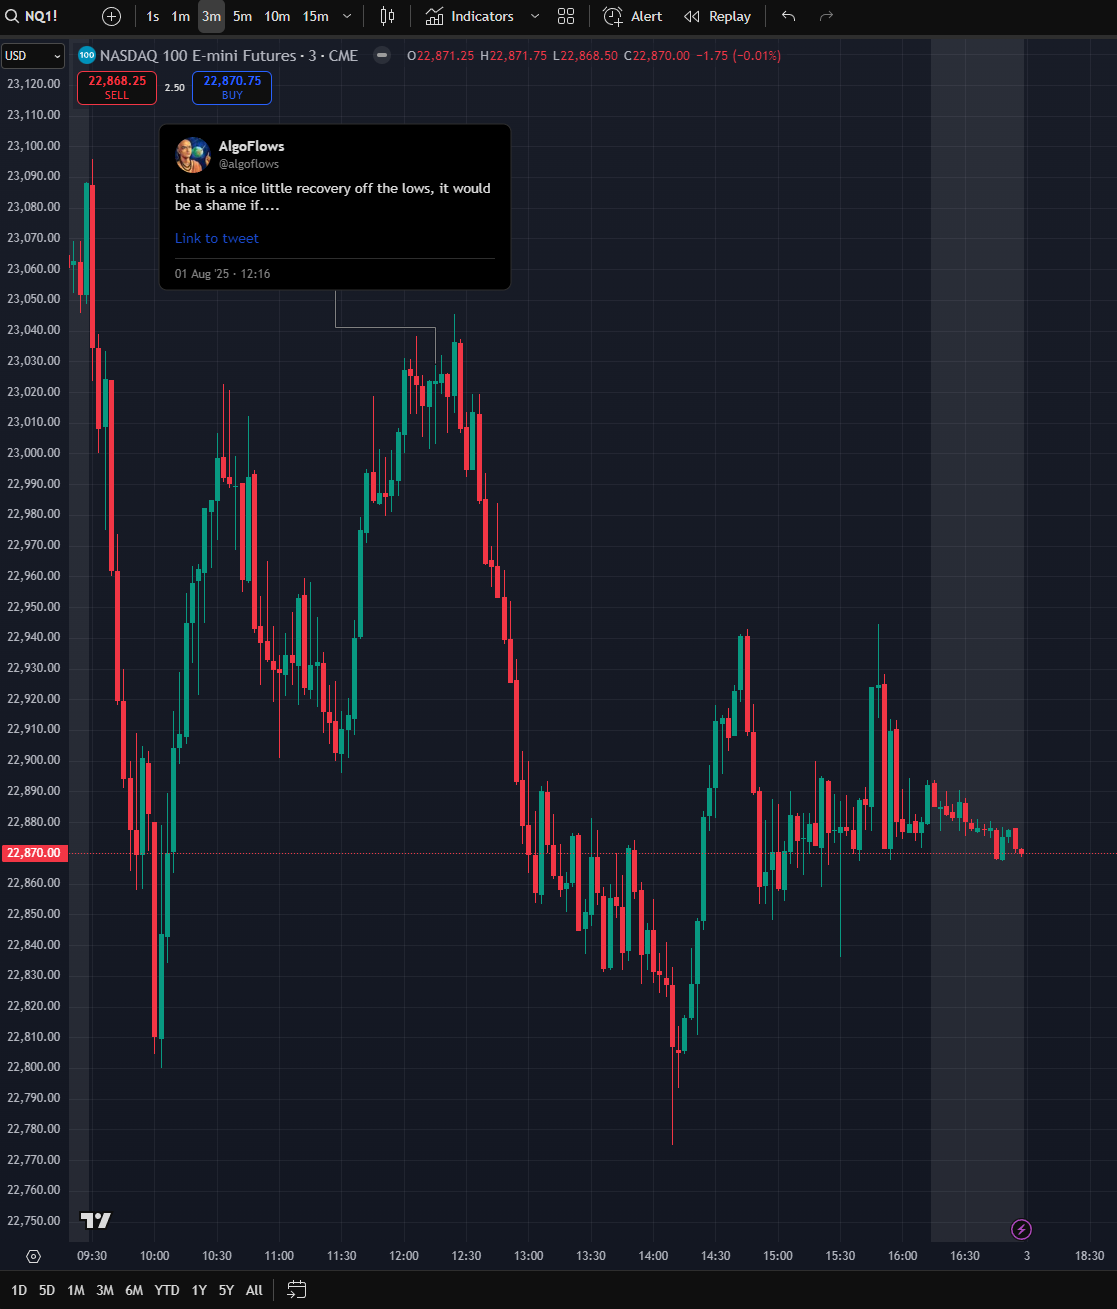
This thesis was shattered on Friday, August 1. A toxic cocktail of the shockingly weak Nonfarm Payrolls report and the official implementation of new, broad-based tariffs sent markets into a freefall. The S&P 500 E-mini futures contract for September delivery (ESU25) plunged, closing the day down 1.72% at 6,264.50. The tech-heavy Nasdaq-100 E-mini futures (NQU25) fared even worse, tumbling 2.06% to settle at 22,883.75. For the week, the S&P 500 lost 2.4%, while the Nasdaq Composite fell 2.2%. The Dow Jones Industrial Average suffered its worst weekly performance in four months, shedding 3.1%. In a clear sign of surging fear, the CBOE Volatility Index (VIX) exploded more than 20%, hitting its highest level in over a month.
The key takeaway from this dramatic reversal is that macroeconomic realities are now decisively trumping positive micro-level news. The rally spurred by Microsoft and Meta's strong earnings was not just erased; it was violently overwhelmed by the subsequent macro shocks. This signals a significant shift in the market regime. The plunge of Amazon (AMZN) shares served as a stark illustration of this new paradigm. Despite the e-commerce giant topping revenue and net income estimates, its stock fell 8.3% on Friday as investors fixated on disappointing growth in its Amazon Web Services (AWS) division relative to the blowout figures from Microsoft's Azure. In a market now laser-focused on signs of a slowdown, even the slightest imperfection in an earnings report is being severely punished.
Friday's sell-off was not merely profit-taking; it was a fundamental and violent re-pricing of the entire economic outlook. In the span of a few hours, the market was forced to digest three alarming realities simultaneously: 1) the U.S. labor market is far weaker and deteriorating more rapidly than previously believed, dramatically increasing the odds of a recession; 2) the new baseline for global trade is unequivocally inflationary and a significant drag on future growth; and 3) the Federal Reserve, having just reaffirmed its patient, hold-steady stance, now appears dangerously behind the curve, raising the specter of a major policy error. The synchronized plunge in equities alongside a collapse in bond yields is the classic signature of a market suddenly pricing in a hard economic landing.
The Fed at a Crossroads: Powell Holds Firm as Dissenting Voices Grow Louder

Against this backdrop of escalating trade tensions and burgeoning economic fears, the Federal Open Market Committee (FOMC) convened for its July policy meeting. The committee's decision to hold interest rates steady, delivered just 48 hours before the disastrous jobs report landed, has damaged the central bank's credibility and exposed a deep ideological rift over how to navigate the new stagflationary environment.
The Decision and the Dissent
As widely expected, the FOMC maintained the target range for the federal funds rate at 4.25% to 4.50%. What was not widely expected, however, was the nature of the vote. In a rare public break from consensus, Federal Reserve Governors Michelle Bowman and Christopher Waller both dissented, indicating a preference for an immediate 25 basis point rate cut. This marked the first time since 1993 that two members of the Fed's Board of Governors voted against the chair's position, signaling a powerful faction within the Fed believes the risk of a sharp economic slowdown now outweighs the risk of persistent inflation.
Bowman and Waller effectively front-ran the weak jobs data, making their position look prescient and the majority’s decision to wait appear complacent. At its core, the dispute reveals a fundamental disagreement within the committee on how to interpret the current inflationary pressures. Chairman Powell's camp appears haunted by the "transitory" inflation miscalculation of 2021-2022, where a supply-side shock was underestimated, leading to de-anchored inflation expectations that required aggressive tightening to rein in. They fear repeating this mistake. The dissenting camp, however, believes the current situation is different, arguing that a slowing economy cannot sustain the kind of broad-based price pass-through that would lead to an inflationary spiral.
Powell's Press Conference: A Hawkish Stance Undercut by Data
In his post-meeting press conference, Chairman Powell projected a confident and somewhat hawkish tone. He defended the decision to hold rates by stating that "the economy is not performing as though restrictive policy were holding it back inappropriately." While acknowledging the potential price impact from tariffs, he framed it as a "one-time price effect" that the Fed would not allow to morph into persistent, higher inflation. He refused to give any clear signal for a rate cut at the next meeting in September, repeatedly stressing that any future decisions would be strictly data-dependent.
The market's immediate reaction was to sell off, correctly interpreting Powell's comments as hawkish and pushing back the odds of a September cut. While this was a correct reading of the Chairman's intent, the subsequent release of the July jobs report rendered his entire economic assessment obsolete. The market is now aggressively pricing in rate cuts despite Powell's rhetoric, not because of it.
The Engine Stalls: Dismal Jobs Report Triggers a Violent Rethink on Growth and Rates
The July Nonfarm Payrolls report, released on Friday morning, was not merely a "miss"; it was a paradigm-shifting data release that invalidated the prevailing "soft landing" narrative. The combination of a weak headline number and massive negative revisions to prior months forced a violent re-pricing across asset classes, as markets scrambled to adjust to a new reality of sharply slowing economic growth and a dramatically altered path for future interest rates.
Deconstructing the Data
The U.S. economy added a paltry 73,000 jobs in July, falling well short of consensus estimates that clustered around 95,000 to 104,000. While disappointing, the headline figure was overshadowed by the revisions. Payroll figures for May and June were revised down by a staggering combined total of 258,000 to 260,000 jobs. The unemployment rate ticked up from 4.1% to 4.2%, in line with expectations.
The revisions are the entire story. The downward adjustment of over a quarter-million jobs fundamentally alters the economic narrative of 2025. It demonstrates that the labor market's weakness did not begin in July; it has been underway and accelerating since the second quarter. The economy was cooling far more rapidly than policymakers, economists, and investors had realized. The Federal Reserve's decision on July 30 to hold interest rates, predicated on the notion of a "solid" labor market, was based on a false premise.
Adding another layer of complexity, wage growth remained stubbornly firm. Average hourly earnings rose by 0.3% for the month, keeping the year-over-year gain at 3.9%. This combination of sharply slowing job growth (a recessionary signal) and still-sticky wage growth (an inflationary signal) is a textbook stagflationary warning. It suggests that while the demand for labor is clearly falling, the supply may also be constrained, which could keep wage pressures elevated even as the broader economy weakens. This is the Federal Reserve's worst nightmare, a scenario that pits its dual mandates of maximum employment and price stability against each other and reinforces the policy dilemma paralyzing the committee.
The Bond Market's Verdict
The bond market's reaction to the jobs report was swift and brutal. Yields on U.S. Treasury securities collapsed. The 2-year Treasury yield, highly sensitive to expectations for Federal Reserve policy, plunged by approximately 18 basis points over the week to close around 3.74%. The benchmark 10-year Treasury yield fell by 14 to 20 basis points, ending the week at a seven-week low of around 4.21%.
This dramatic rally in bonds was a direct reflection of a massive shift in interest rate expectations. According to futures market pricing, the probability of a 25-basis-point rate cut at the Fed's September meeting skyrocketed from just 39% before the report to 84% immediately after. By the end of the day, markets were fully pricing in two rate cuts by the end of 2025.
The violent repricing in the bond market carries a clear message. The sharp plunge in short-term yields is the market's way of shouting that the Fed made a policy error by not cutting rates in July. The bond market is now overriding Chairman Powell's cautious rhetoric and attempting to force the central bank's hand. The concurrent rally in long-duration bonds, evidenced by the falling 10-year yield, is a classic flight-to-safety move, signaling that recession fears are no longer a distant possibility but a primary concern for investors.
The Geopolitical Powder Keg: Supply Shocks Loom Over Energy Markets
While demand-side fears of a recession dominated the week's headlines and catalyzed the rout in equities, a parallel and opposing story was unfolding on the supply side. Geopolitical risks in the energy market have intensified dramatically, creating a tense standoff that is putting a firm floor under crude oil prices. Threats emanating from both the Russia-Ukraine and Iran-Israel conflicts are acting as a powerful inflationary counter-current to the narrative of a global slowdown, adding yet another layer of complexity for policymakers and investors.
Russia & The West: The Secondary Sanctions Threat.

The United States has escalated its economic pressure on Russia, moving beyond direct sanctions to actively threatening secondary sanctions against third-party nations that continue to purchase Russian energy. This includes the possibility of imposing tariffs as high as 100% or, in some legislative proposals, even 500% on imports from countries like China and India if they do not cease their trade in Russian oil, gas, and uranium.
This represents a fundamental shift in strategy with profound implications for the global oil market. Previous measures, such as the G-7 price cap, were designed to limit Russia's revenue while ensuring its oil continued to flow to global markets to prevent a price spike. Secondary sanctions, in contrast, are designed to shut in that supply entirely. Russia currently exports around 5 million barrels of crude oil per day, accounting for roughly 10% of global supply. Removing even a fraction of this volume from the market would be exceptionally difficult to replace, with some estimates suggesting a potential global shortfall of 3 to 5 million barrels per day if Russian oil were fully embargoed.
This threat constitutes a credible "black swan" risk for oil prices. Unlike demand-driven fluctuations, a supply shock of this magnitude would be sudden and severe. Market analysts widely believe that the successful implementation of secondary sanctions could easily send Brent crude prices surging toward $100 to $120 per barrel. The mere existence of this threat is creating a significant geopolitical risk premium that is being priced into every barrel of oil. This strategy also creates a painful internal policy contradiction for the White House. Using trade policy as a weapon to achieve foreign policy goals in Ukraine directly conflicts with the domestic priority of controlling inflation. Triggering a massive oil price spike would be highly inflationary, damaging U.S. consumer sentiment and directly undermining the Federal Reserve's efforts. This contradiction makes the threat's deployment unpredictable but also more dangerous to market stability.
Iran-Israel Shadow War: The Strait of Hormuz Premium
Simultaneously, tensions in the Middle East remain at a boiling point following the direct military exchanges between Israel and Iran in June 2025. The conflict continues to simmer, with ongoing Israeli military operations in Gaza and the U.S. imposing fresh sanctions on Iranian entities. For the oil market, the primary risk remains a potential disruption to maritime traffic through the Strait of Hormuz, a critical chokepoint through which nearly one-fifth of the world's daily oil supply passes.
This persistent risk of a wider conflict in the Middle East is providing a strong floor for oil prices. While fears of a global recession should theoretically be pushing crude prices lower, the market cannot ignore the possibility that a direct attack on Iranian energy infrastructure or an attempt to blockade the Strait of Hormuz would instantly override any and all demand-side concerns. This dynamic explains the paradoxical price action of the past week: even as equity markets crumbled under the weight of recessionary fears, West Texas Intermediate (WTI) crude oil managed to post a weekly gain of over 3%. The floor under oil is not economic; it is geopolitical.
An escalation in the Middle East would immediately test the world's spare production capacity, a safety buffer held almost exclusively by Saudi Arabia and the United Arab Emirates. While OPEC possesses the ability to increase production, it may not be sufficient to fully offset a major, sustained disruption. Deploying that spare capacity would eliminate the world's safety cushion, leaving the market hyper-sensitive to any subsequent outages anywhere in the world. This structural tightness means any future escalation would have a dangerously amplified impact on global energy prices.
Technical Outlook and Strategic Trade Ideas for the Week of August 4
The dramatic reversal from all-time highs has inflicted clear technical damage on the charts of major risk assets, suggesting that a period of consolidation or further downside is the most probable path forward. The macro narrative has shifted decisively from optimism to caution, and this sentiment is now being reflected in key price patterns and indicators.
E-mini S&P 500 (ESU25): The Bearish Reversal
The most significant technical development of the week was the massive "bearish engulfing" candle that formed on the daily chart on Thursday, at an all-time high. This classic and powerful reversal pattern, where a day's trading range completely envelops the previous day's range in the opposite direction, was decisively confirmed by Friday's sharp sell-off. The price has now sliced through its 20-day simple moving average for the first time since late June, a clear signal of a shift in the short-term trend. I personally do not believe in Technical Analysis but this is something a lot of CTAs would like to look at so sharing this information.
Key Levels:
Resistance: The zone between 6340 and 6350, which was previous support, now acts as the first line of resistance. The all-time high of 6373.50 is the ultimate ceiling.
Support: Friday's low around 6239.50 is the immediate support level. Below that, the psychological 6200 level is a likely target, followed by the 50-day moving average, currently ascending toward the 6150 area.
Trade Idea: Fade Rallies.
Strategy: The path of least resistance appears to be lower. The most prudent strategy is to sell into any counter-trend bounces, viewing them as opportunities to initiate short positions at more favorable levels.
Entry: Look for signs of exhaustion on intraday charts (e.g., 1-hour or 4-hour) as the price approaches the 6300-6340 resistance zone. An entry around 6325 would be ideal.
Stop-Loss: A stop-loss should be placed above 6375 to protect against a sharp reversal that invalidates the bearish pattern.
Target: The initial target is a retest of Friday's low near 6240. A secondary, more ambitious target would be a move down to around 6150.
E-mini Nasdaq-100 (NQU25): Tech's Vulnerability
The Nasdaq-100 showed notable relative weakness on Friday, with the futures contract falling over 2%. Similar to the S&P 500, the NQ printed a major reversal pattern at its peak. As a collection of long-duration growth assets, the Nasdaq is particularly sensitive to shifts in interest rate expectations. While the collapse in bond yields would normally be supportive, the reason for the collapse—rising recession fears—is a profound negative for the lofty earnings expectations of high-growth technology companies. The risk has shifted from rising rates to falling revenues. I personally do not believe in Technical Analysis but this is something a lot of CTAs would like to look at so sharing this information.
Key Levels:
Resistance: The 23200-23300 zone, a prior support area, is now the first level of resistance. Thursday's high near 23845 represents a more significant barrier.
Support: Friday's low around 22750 is the immediate floor. A break below this level would open the door to the next major medium-term support level, identified around 22200.
Trade Idea: Short on Break of Friday's Low.
Strategy: The downward momentum is strong and confirmed by high volume. A break of the week's low could trigger another wave of technical selling and stop-loss orders.
Entry: A tactical short position can be initiated on a clean, decisive break below the 22750 level.
Stop-Loss: Place a stop-loss order above the 23000 psychological level.
Target: The next major support structure is around 22200, offering a compelling risk/reward ratio for the trade.
Bitcoin (BTC/USD): The $120,000 Rejection
Technical Analysis: Bitcoin's price action is being dominated by its failure to decisively break and hold above the critical $120,000 resistance zone. This level represents not only the recent all-time high but also a major psychological barrier for the market. The sharp sell-off from this peak has broken the short-term rising trend channel, signaling a potential trend change and opening the door for a deeper correction. Further confirming this loss of momentum, the daily RSI is showing a clear falling trend (negative divergence), a classic warning sign that the underlying buying pressure is waning even as price made its final push higher.I personally do not believe in Technical Analysis but this is something a lot of CTAs would like to look at so sharing this information.
Key Levels:
Resistance: The entire zone from $119,000 to $120,800 is now formidable resistance.
Support: Initial support lies at the recent low of $115,000. However, the more critical support zone is between $111,000 and $112,000. A break below this area would likely signal a larger, medium-term trend change to the downside.
Trade Idea: Range Trading with a Downside Bias.
Strategy: Following the failed breakout attempt, the path of least resistance is now sideways to lower. The market appears to be entering a consolidation phase after a strong run.
Entry: A short position could be initiated on a bounce toward the middle of the recent down-move, around $116,500, in anticipation of a test and potential break of the $115,000 support.
Stop-Loss: A stop should be placed above $118,500 to protect against a sudden recovery in bullish sentiment.
Target: The primary target for a short position is the critical support zone around $111,500. A confirmed break of this level would open up a much deeper correction, with the next major support found near $106,000.
Crude Oil (WTI - CLU25): The Geopolitical Tug-of-War
Technical Analysis: WTI crude oil is technically range-bound, a clear reflection of the fundamental battle between recessionary demand fears and geopolitical supply risks. The price action is characterized by consolidation between a well-defined support base and a resistance ceiling. Key moving averages are beginning to flatten, indicating a lack of a clear directional trend.
Key Levels:
Resistance: The zone between $69.60 and $70.50, encompassing the weekly high and a key psychological level, is the primary resistance.
Support: The weekly low around $66.70 provides initial support, with the more significant downside support level at $65.00.
Trade Idea: Straddle the Range or Play the Breakout.
Strategy 1 (Range Trading): For traders expecting continued consolidation, selling near the top of the range (around $70) with a stop-loss above $71, while targeting a move back to the bottom of the range (around $67), is a viable strategy. Conversely, buying near the bottom of the range (around $67) with a stop below $66, targeting a move back toward the highs, could also be employed.
Strategy 2 (Breakout Trading): For those anticipating a resolution to the current standoff, a breakout strategy is more appropriate. A confirmed daily close above $71 could be bought, with an initial target of $73 and a secondary target of $76. Alternatively, a confirmed daily close below $66.50 could be shorted, targeting the major support level at $65.00. This strategy requires patience and waiting for a clear catalyst to drive the price out of its current equilibrium.
The Path Forward: Navigating a Market Driven by Policy and Politics
The past week has precipitated a fundamental repricing of risk across global markets. The "soft landing" narrative, which had propelled equities to record highs, is effectively dead, replaced by mounting fears of a stagflationary slowdown. The Federal Reserve, caught off guard by the speed of the labor market's deterioration, is now widely perceived as being behind the curve, increasing the risk of a policy mistake. As the market enters the first full week of August, it does so with a profoundly altered perspective, where downside risks have moved from the periphery to the forefront of investor consciousness.
The Week Ahead: A Data Vacuum
The economic calendar for the week of August 4-8 is relatively light on top-tier, market-moving data, which may leave a vacuum for the new bearish narrative to fill. Key releases include the final Services PMI and ISM Services PMI on Tuesday, weekly jobless claims on Thursday, and wholesale inventories on Thursday. While these data points will be monitored, they are unlikely to possess the market-moving power of the previous week's jobs report.
In the absence of major data releases capable of challenging the newly established narrative, market sentiment and technical price action will likely be the dominant drivers. This environment increases the probability of downside follow-through from Friday's powerful sell-off. Any unexpected headlines related to U.S.-China trade, geopolitical flare-ups in the Middle East or Eastern Europe, or unscheduled comments from Federal Reserve officials will likely have an outsized impact on market volatility.
All Eyes on the Auctions
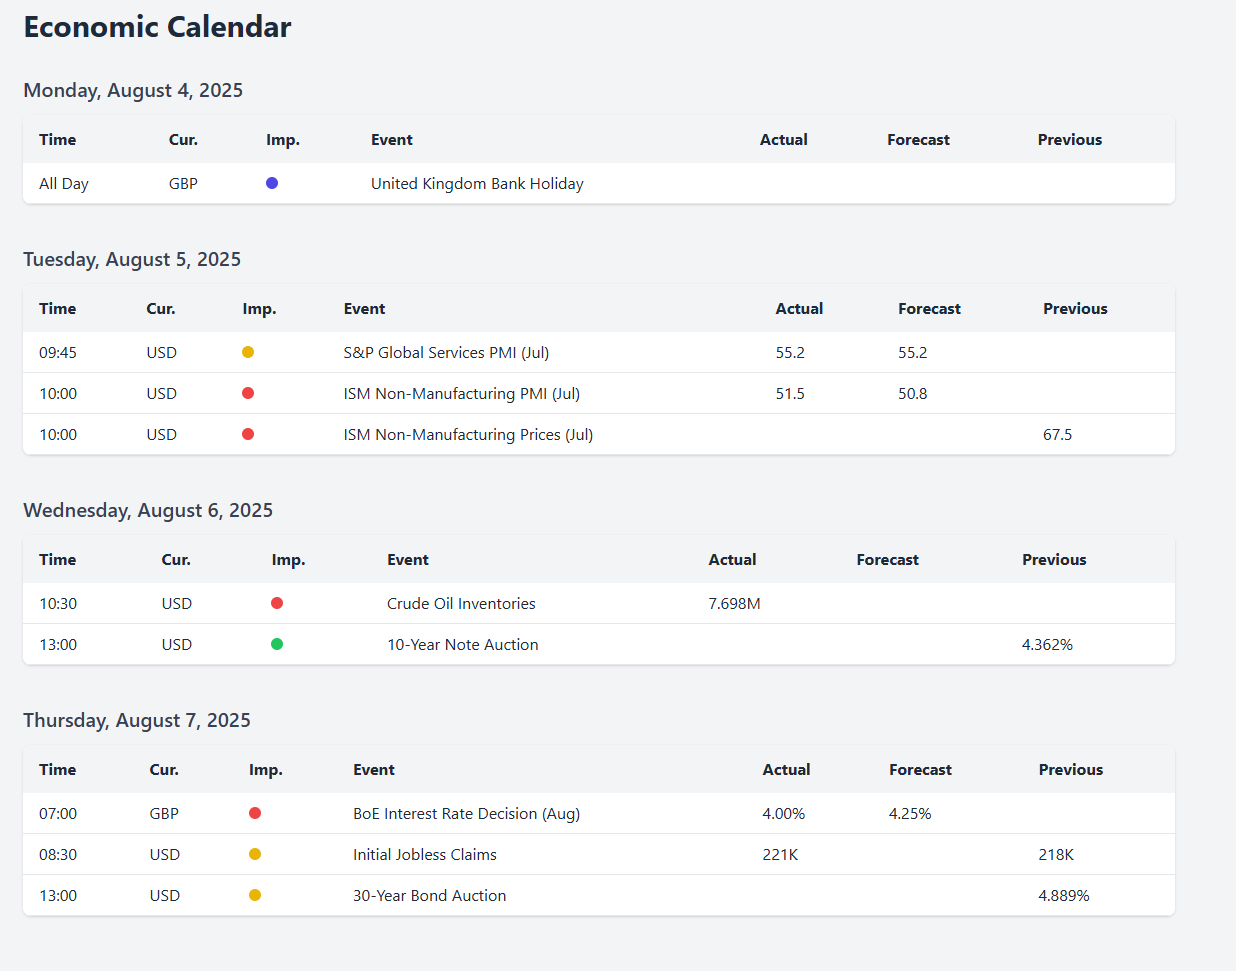
The most important scheduled events of the week are the Treasury's quarterly refunding auctions for 3-year, 10-year, and 30-year debt, set for Tuesday, Wednesday, and Thursday, respectively. These auctions will serve as a crucial, real-time referendum on the market's conviction in its new outlook. Strong auctions, characterized by high demand and low resulting yields, would validate the bond market's recessionary fears and could place further downward pressure on equities. Conversely, weak auctions could signal that investors are growing concerned about the massive supply of U.S. debt and the nation's long-term fiscal sustainability. Such an outcome could put a floor under interest rates even as the economy weakens, creating a more entrenched stagflationary environment that would be a significant headwind for all U.S. assets.
WEEKLY LEVELS
Subscribers are urged to use the tradingview indicator to plot the levels.
NOTE: SUBSCRIBERS ARE URGED TO JOIN THE DISCORD AT THEIR EARLIEST CONVENIENCE.
