
Weekly Market Outlook 8/10/2025
row row the boat, gently up the stream

Hello traders,
Hope you all had a great weekend.
You can jump to the Weekly levels by clicking on them directly.
AUDIO SUMMARY OF THIS ARTICLE HERE
Algo, I’m not gonna read your long post or listen to a 21 minute AI audio without a soul, can you show me a picture that summarizes everything please please please?
OK FINE.
SPX WEEKLY HEATMAP
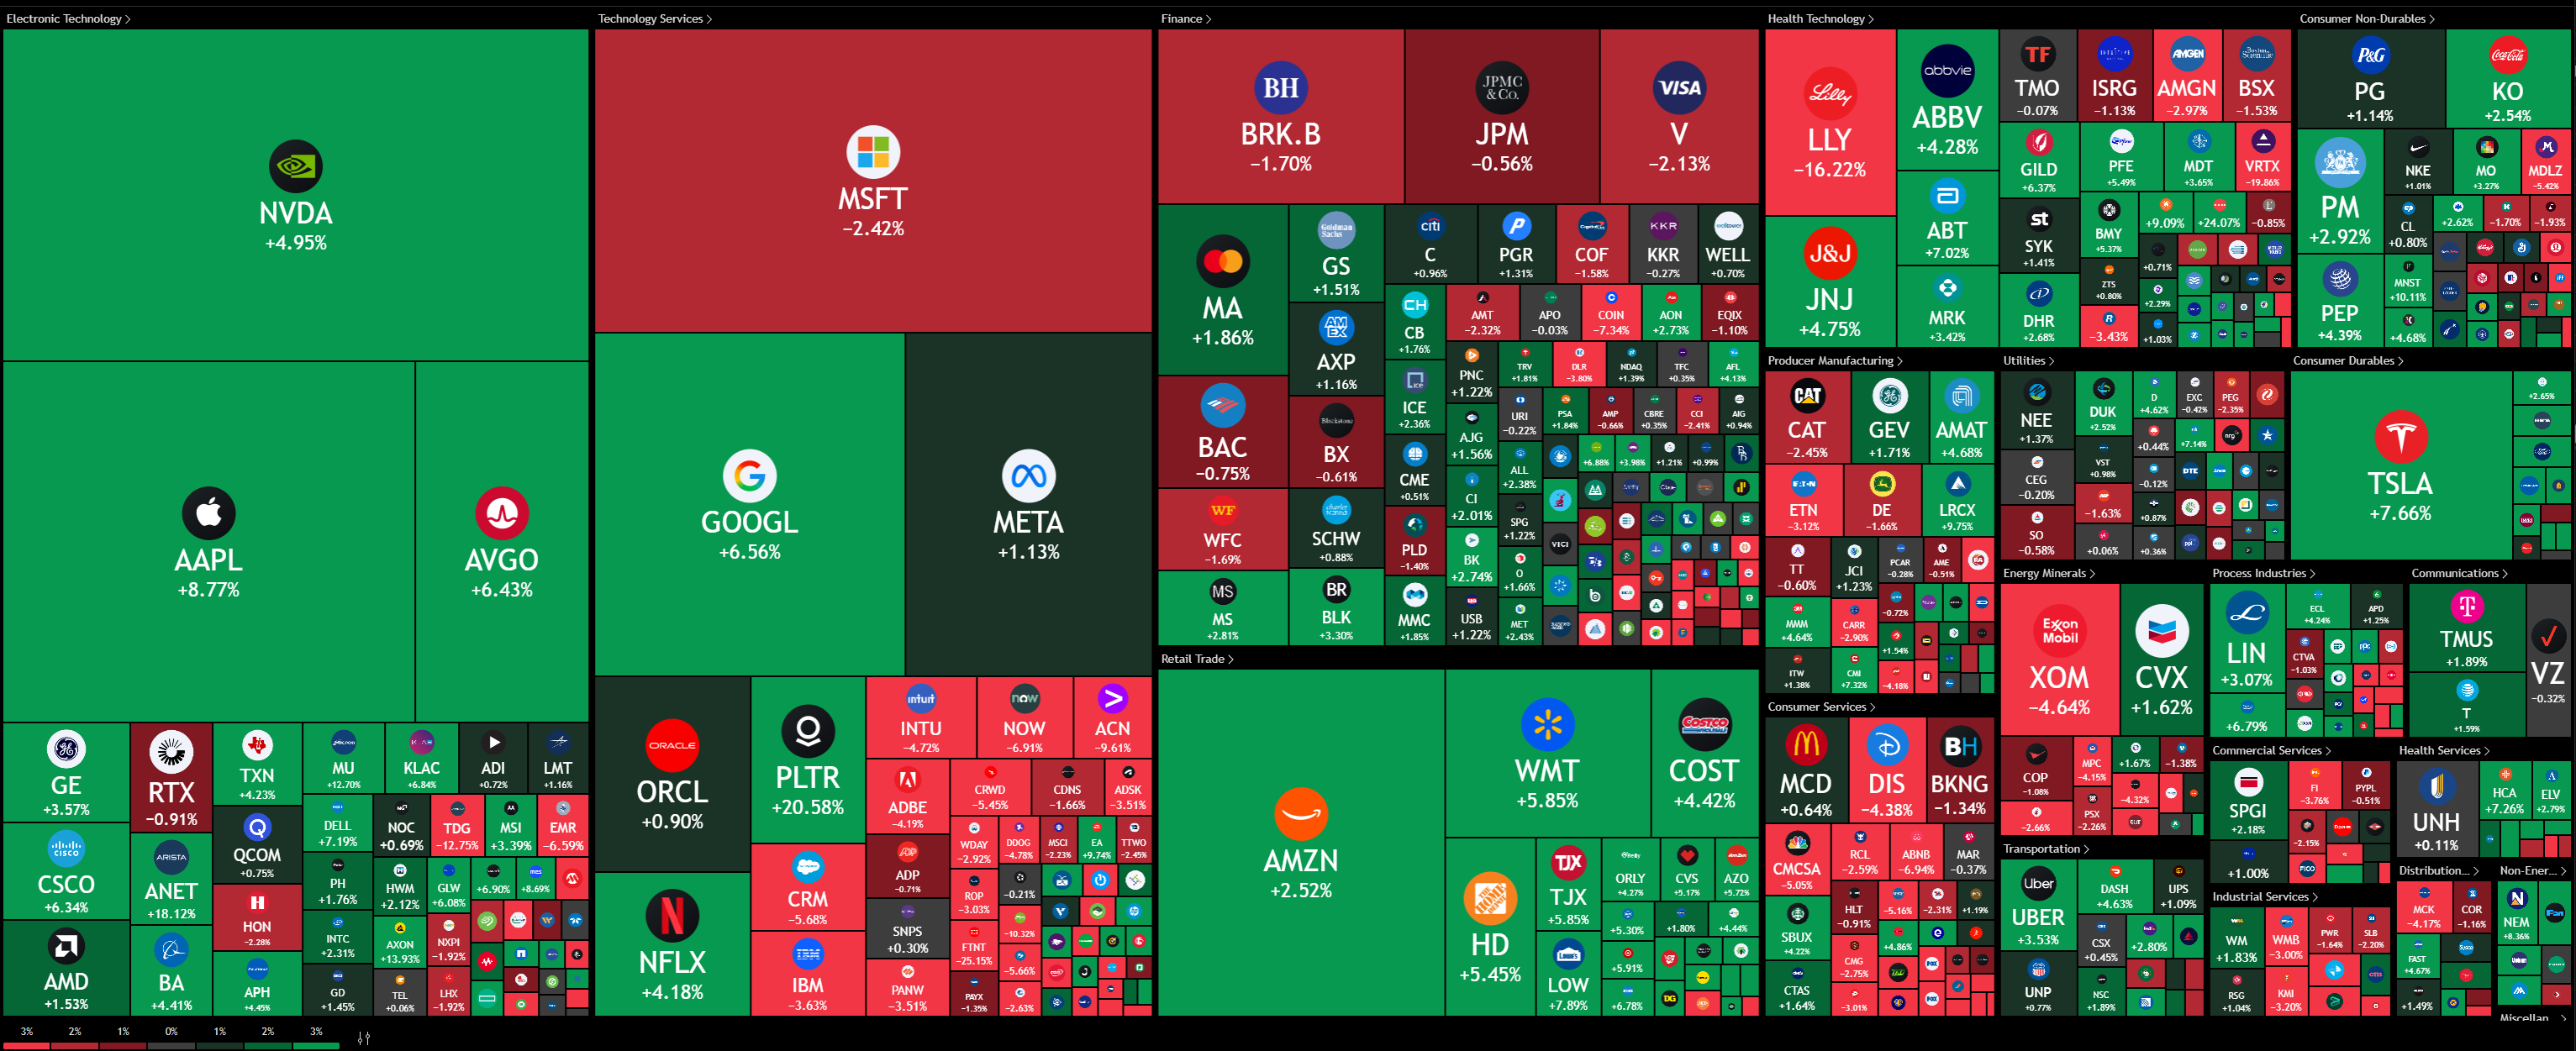
Apple jumped on policy relief and a tech rally. On Aug 6 it pledged another $100B in U.S. manufacturing, taking its total to $600B. The White House tied 100% chip tariffs to domestic build commitments, signaling exemptions for Apple. Markets repriced lower tariff risk and pushed the stock up about 8% for the week.
A Market Rewired by Policy, Power, and Price Signals
Policy is setting the boundaries for returns. Earnings still matter, but tariff schedules, summit calendars, and security rules now anchor paths for equities, rates, energy, and digital assets. The week ending August 8, 2025 delivered a clear split. Technology advanced on a mix of resilient earnings and growing rate cut hopes. Energy sold off as the market priced a higher probability of a Russia Ukraine peace path that could bring sanctioned barrels back. Bonds rallied on cut odds despite fresh tariff inflation risk. Crypto gained on incremental access wins in retirement channels. The common driver is state action. Trade architecture and security priorities are the key variables.
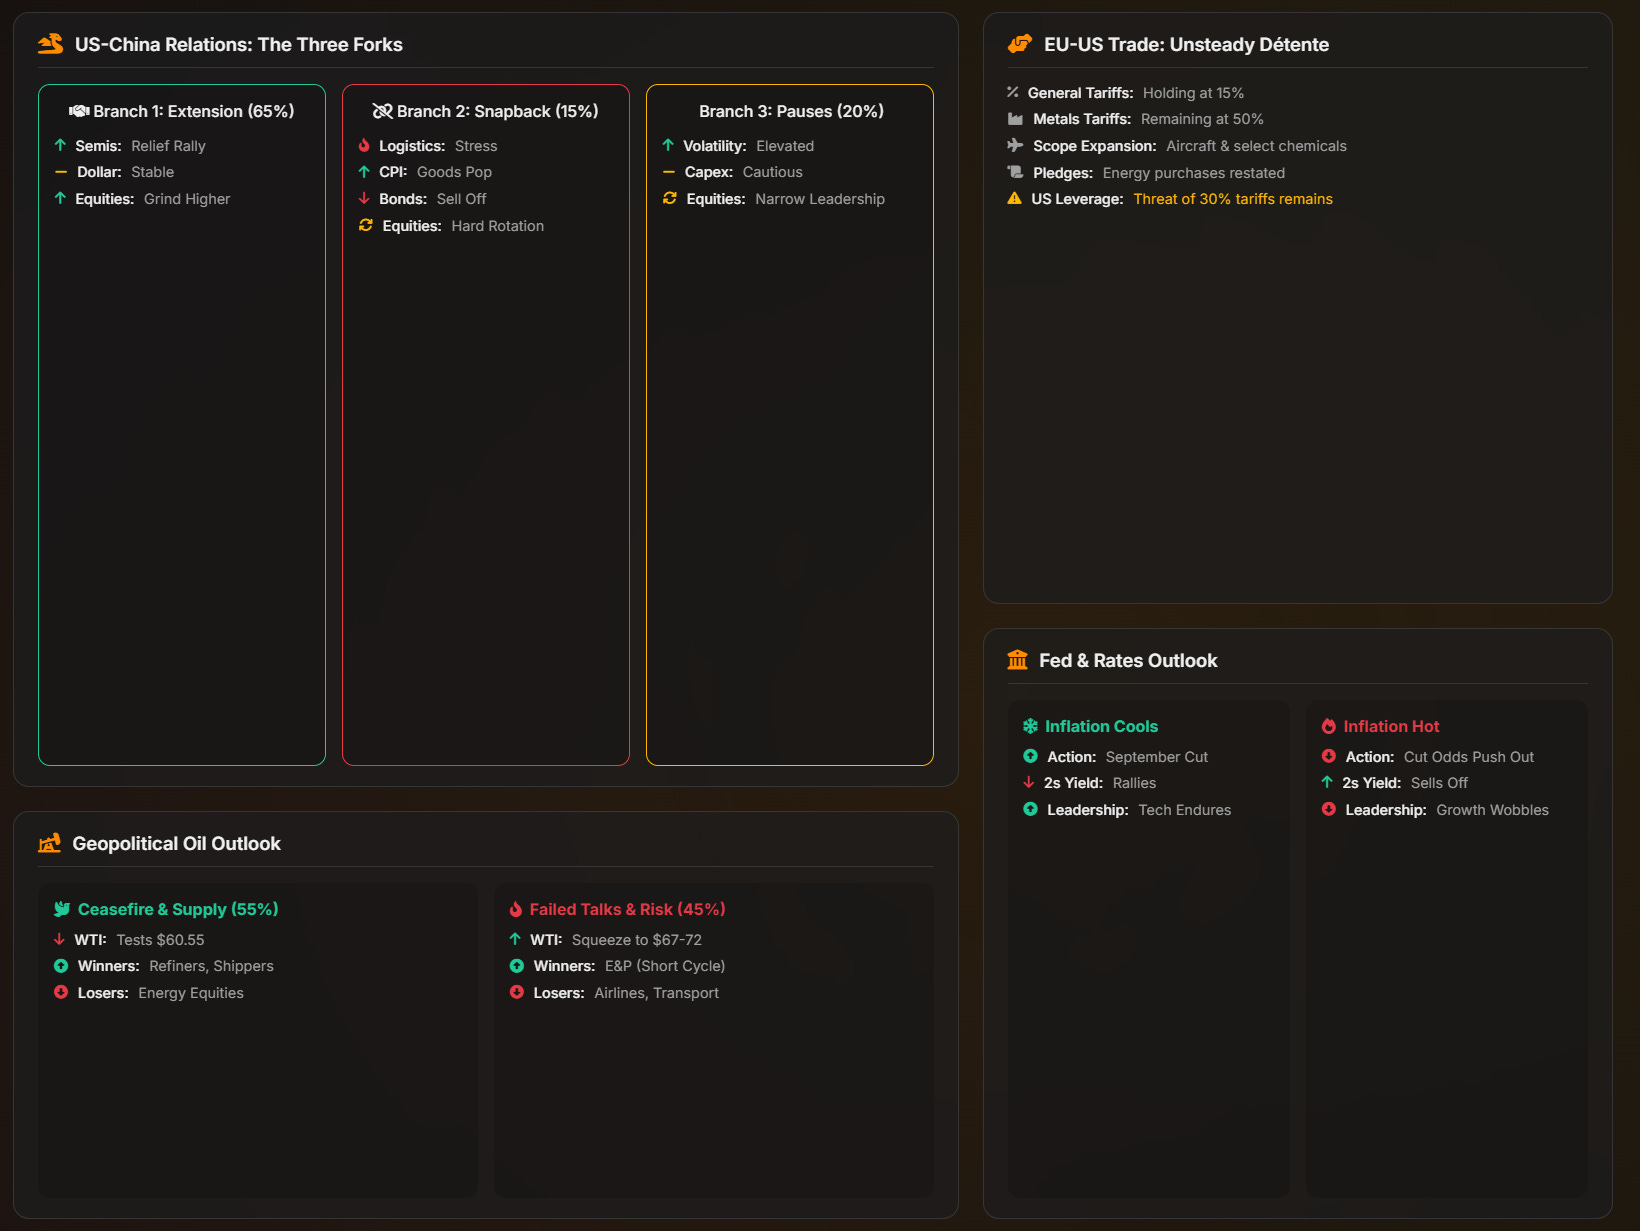
The new transatlantic deal capped most EU goods at a single 15 percent U.S. tariff. Relief versus the threatened 30 percent headline came with strings. Carve outs gave some sectors a partial reset, while 50 percent duties on European metals stayed. The agreement also carried large nonbinding EU pledges to buy American energy and steer investment to the United States. The European story is damage containment. The U.S. story is power exercised. Both are true. Markets should read this as a higher baseline cost of trade with optionality concentrated in Washington.
Tension with China is on a timer. The 90 day tariff pause expires Tuesday August 12. Talks in Stockholm did not close the gap. The White House is running China on a separate track backed by national security framing. A floated 100 percent tariff on imported chips would be a structural attempt to redirect supply chains. That is not a revenue tool. It is a control tool. Scenarios range from another 90 day extension to a snapback to near embargo levels. Probability mass is wide. Outcome variance is high.
Oil’s weakness is the market’s judgment that a European peace path is more probable in the near term than a renewed Middle East outage. Iran Israel remains a latent risk, but the pricing signal says supply relief from Russia would outweigh that tail risk if the Alaska summit produces a result. Equity and rate markets are acting like growth will endure and inflation will drift lower. That mix is fragile. If tariff pass through accelerates or if goods inflation re accelerates, the cut narrative will collide with the Fed’s credibility constraints.
90% of this plan is free and only the weekly levels are paywalled. Realtime Discord access with intraday orderflow & option dealer summaries included with the paid newsletter membership . Click here to subscribe.
I. Transatlantic Trade: De escalation at a Higher Price

1) Architecture
The U.S. and EU negotiated a framework that installs a single 15 percent ceiling on most EU goods entering the United States starting August 1. Average duties on EU exports at the end of 2024 were near 1.5 percent. The new ceiling is a step up in baseline cost. The cap applies to autos and auto parts, which sidestepped a pending move to 27.5 percent. Sensitive sectors under security investigations such as pharmaceuticals and semiconductors are now bounded by the 15 percent lid. Aircraft parts and some chemicals returned to lower pre January rates. French wine and spirits remained in limbo pending a final carve out list. Heavy industry kept the weight. Steel, aluminum, and copper stayed at 50 percent with tariff rate quotas set near historic volumes.
This is not a classic market opening deal. It is a risk containment device. The strong hand used the threat point of 30 percent to get price and energy alignment without giving symmetric concessions. The EU gets a ceiling that reduces tail risk but accepts higher average cost and sector specific pain. The United States gets a durable lever with political and strategic value.
2) Pledges and asymmetry
Two headline numbers stood out. The EU pledged to facilitate roughly 750 billion dollars of U.S. energy purchases through 2028 and to catalyze about 600 billion in private EU investment into the United States. These numbers are directional signals, not binding contracts. Brussels cannot compel private firms to hit those targets. That gap between announcement and enforceability embeds a future trigger. If measured progress lags, Washington can claim breach and reopen escalation. Optionality sits with the party that controls the tariff switch. That is the asymmetry that matters for markets.
The policy vector also lines up with U.S. strategic goals. European reliance on Russian energy has been a persistent vulnerability. Directing EU energy demand toward U.S. LNG, oil, and nuclear inputs shifts dependence away from Moscow and into a North Atlantic channel. Industrial access for certain U.S. goods improves at the margin. The EU will remove low level duties on a set of American industrial products and expand tariff rate quotas for selected agricultural items. For European metals, the pressure stays in place.
3) Signals for assets
Equities tied to U.S. energy infrastructure, shipping, and export logistics gain a policy put. European cyclicals that depend on U.S. demand carry a new drag. Auto producers got relief versus a worst case, yet are still facing a material cost wedge. Airlines and aerospace names benefit from the partial reversion to pre January rates for aircraft and parts. Credit spreads for European industrials should reflect the new steady state of cash flow headwinds where passthrough pricing power is limited.
The higher level signal is that the administration can and will use tariff ceilings as a steering wheel. The deal also sets a pattern of large public purchase promises paired with light legal enforcement. Investors should expect this style to show up in other negotiations and to be referenced as precedent in China talks. The tail risk of a fresh U.S. tariff hike toward 30 percent has been reduced for the EU while the baseline cost rose. That is a classic relief rally setup for certain sectors but a valuation cap for others.
II. Sino American Negotiations: Supply Chains on a Cliff
1) The deadline and the legal track
The current 90 day pause on U.S. China tariff escalations expires Tuesday August 12. Stockholm talks between Treasury Secretary Scott Bessent and Vice Premier He Lifeng did not produce an extension. Public signaling from Washington kept a second 90 day delay on the table, but no order had been signed by week’s end. A separate executive action in early July explicitly carved out the China pause and left it untouched by the broader tariff moves applied to other countries. That confirms the White House is treating China as a distinct case anchored in national security law rather than trade preferences.
2) From balances to control
The argument has shifted from deficits and reciprocity to technology and security. A floated 100 percent tariff on imported semiconductors and chips with an exemption for U.S. made production is a qualitatively different instrument. Such a tariff is not designed to collect revenue or to nudge negotiation. It is intended to force permanent re routing of the electronics value chain and to wall off advanced compute inputs from Chinese access. That is consistent with a policy that now treats compute as a strategic commodity.
The scope of this proposal would also hit allies that fabricate chips outside U.S. borders. The structure and any waiver regime would matter. A strict rule without broad exemptions would pull non Chinese producers into a reshoring funnel. A narrow rule aimed only at Chinese origin chips would push multinational firms to re label and re route. In either case, friction costs would rise.
3) What the EU template implies for Beijing
The EU deal offers a read through. The administration used tariff threats to secure massive headline commitments on purchases and investment without offering symmetric tariff relief. Expect a similar playbook with China. Extension of the current pause alone is unlikely to be declared success. The ask will include hard numbers on agricultural and energy buys, measurable changes in data and export control enforcement, and visibility into supply chain provenance for sensitive components. The odds of a comprehensive settlement are low because the core dispute is about power, not price. A rolling series of pauses with escalating asks is more likely. A lapse that triggers a snapback to near embargo levels sits in the tail but cannot be dismissed.
4) Scenarios and market paths
Base case: a short extension, 60 to 90 days, paired with a formal outline of working groups and public targets. The rulemaking process for any chip tariff continues in parallel. Equity reaction would be a relief bounce in semis and hardware with underperformance from names most exposed to Chinese end markets. Rates would be steady to lower as cut odds stay intact. Oil would remain under pressure due to the Europe peace trade narrative.
Adverse case: no extension, tariffs snap back toward 145 percent on U.S. imports from China and 125 percent on China’s taxes on U.S. goods. Supply chain disruption would be immediate. Logistics networks would seize up. Inventories would spike. CPI goods components would accelerate. The curve would bear steepen as the front end priced a slower cut path and long bonds reset for higher term premium. Equities would rotate toward domestically sourced inputs and away from import dependent OEMs. Credit spreads would widen fastest in retail and consumer durables.
Longer glide path: rolling 90 day pauses with periodic sector specific escalations and carve outs tied to verification milestones. This keeps uncertainty high and capex cautious. It also keeps the dollar supported against trade dependent currencies. Volatility would remain elevated as public statements set short term risk on and risk off swings around each deadline.
III. Geopolitics and Energy: Two theaters, one price signal
1) Ukraine peace path and oil
The announcement of an Alaska meeting between the U.S. and Russia on Friday August 15 created a new vector for oil. The stated goal is a negotiated end to the war. Moscow rejected a three way format including Kyiv and has kept the line that a Putin Zelenskyy meeting would only occur in a final phase. On the ground, Russia made incremental gains over the past month and Ukrainian units reported strain along key fronts. Polling inside Ukraine showed rising openness to a negotiated outcome compared with earlier phases of the war. That backdrop matters for markets because sanctions relief is the lever that can move millions of barrels per day.
If a ceasefire leads to staged sanctions rollback, volumes from Russia would recover into a market that is already preparing for higher OPEC plus output later this year. Storage data in the United States show inventories near the lower end of five year ranges, yet price fell as the supply outlook changed. Price is the report card on expected flows. The week’s five percent drop in WTI and the broader eighteen percent drawdown since late June point to the market shading toward peace in Europe.
2) Iran Israel freeze and the Hormuz risk
The Iran Israel ceasefire that took effect June 24 held through the week. Statements from senior IRGC officials framed the pause as temporary. Messaging highlighted repairs to air defense networks and retained missile capacity. The nuclear file did not soften. Tehran kept its public stance on domestic enrichment. Washington continued to tie any broader regional arrangement to clear limits on Iran’s program and to action against Hezbollah’s offensive inventory in Lebanon. Iraqi militia allies signaled opposition to any U.S. move in Lebanon. That structure leaves a latent tail risk of renewed missile and drone activity that could affect shipping through the Strait of Hormuz. The market priced that tail as secondary to the Russia path this week.
3) What this means for commodities and risk
Energy equities lag when crude trends lower. Refiners can benefit from cheaper feedstock if demand holds. Shippers gain on volume if seaborne trade grows under a peace regime. Base metals present a mixed picture. Relief on European manufacturing input costs clashes with slower global demand if tariffs hit. Agricultural commodities would respond to any China deal that includes large purchase commitments. Uranium sentiment is supported by the EU deal’s language on nuclear inputs and by global plans to extend reactor lifetimes.
For multi asset portfolios the higher level point is dispersion. Policy creates binary catalysts. Oil can gap on headlines. Equity factors can flip. Position size and exposure concentration matter more than usual in this regime.
IV. The Fed: A narrow path between price pressure and politics

1) The meeting and the dissent
The FOMC kept the policy rate at 4.25 to 4.50 percent on July 30. Two governors publicly dissented for a 25 basis point cut. The statement shifted the growth description from solid to moderate. Chair Powell acknowledged that new tariffs would push some prices higher as pass through builds. Those details confirm a growing dovish wing and a leadership trying to weigh inflation risks against a softer growth pulse.
2) The stagflation trap
Tariffs are taxes on imports. They push up prices for tradable goods. They can also chill demand and delay capex plans. That is a stagflation impulse. The Fed’s dual mandate forces a tradeoff in that setting. Cutting too quickly risks validating a fresh inflation wave. Keeping rates high risks forcing a sharper slowdown. Pressure from the elected branches for lower rates raises the temperature around the institution’s independence. Market pricing now implies a high probability of a September cut. That pricing sits awkwardly beside a new policy mix that tends to lift goods inflation.
3) The data pivot
Next week’s CPI and PPI reports will decide the near term path. A hot set would push the front end up and knock equities that depend on duration support. A cool set would lock in the prevailing narrative and extend the bid in growth. Retail sales will fill in the demand side. A strong print will be double edged. It will read as growth support yet also as scope for the Fed to wait. A soft retail number will add to the dovish case but also raise earnings questions for cyclicals.
V. Rates: A curve that believes in cuts and growth at the same time
Treasury yields at the Friday close clustered at 4.24 percent for 3 month bills, 3.77 percent for 2 year notes, 3.84 percent for 5s, 4.29 percent for 10s, and 4.85 percent for 30s. The 2s 10s spread sat near plus 51 basis points. A positive slope signals a forward view that growth is not collapsing. The same tape also prices an early and steady cut path. That is a tension. The bond market is saying both that growth will be fine and that policy will ease. The explanation is that inflation will glide lower enough to let the Fed cut without stress. That is plausible only if tariff pass through is mild and services disinflation persists.
Auction supply next week will test demand. Bill sales early in the week will show cash appetite. Any wobble will widen term premium as the market demands more compensation for fiscal and inflation risk. A CPI surprise to the upside would raise tail risk of a hawkish pause in September or a slower glide after an initial cut. The sharpest repricing would come in the belly where cut expectations are concentrated.

VI. Weekly Performance and Technical Map
Headline numbers
Nasdaq 100 E mini gained 1.79 percent. S&P 500 E mini gained 0.90 percent. Bitcoin rose 3.49 percent. WTI crude fell 5.12 percent. These moves map to the policy and geopolitics above. Growth and rate sensitive tech led. Energy lagged on supply relief odds. Digital assets benefited from incremental access news in U.S. retirement channels.
A) S&P 500 E mini and Nasdaq 100 E mini
Performance drivers were clear. Large cap tech continued to lead on AI spending narratives and steady beat rates in Q2. A major handset and platform name signaled higher capital spending tied to on device AI. The S&P still trailed the Nasdaq, reflecting narrow leadership. Breadth measures improved only modestly.
On levels, ES probed its 20 day moving average near 6318 and found support. Resistance sits near 6427. A daily close above unlocks 6469 and then 6554 in extension. Failure near 6427 leaves a retest of 6240 on the table. For NQ, momentum stayed elevated. Resistance near 23845 capped the first attempt. A strong push through that area would target 24084 with support near 23555 and then 23396.
Risk framing: if CPI comes in hot, momentum longs in NQ are exposed to a factor rotation out of long duration growth. If CPI cools, the path of least resistance is a grind higher with dips bought at the 20 day moving average in both indices.
B) Bitcoin
Price advanced about 3.5 percent as policy rhetoric on 401k access improved the demand story. The daily chart shows a large flag pattern after the push to new highs this summer. A daily close above 118k to 119k would confirm a breakout and set sights on 123,236 then the 125k area. Support rests near 114,555 and then 112,916. Position sizing is the primary risk control. Volatility is elevated around macro catalysts in this asset.
C) WTI crude
September futures settled near 63.85. The trend is down. Price broke below the 20, 50, and 200 day moving averages and turned those into resistance. The bounce zone sits between 67.25 and 68.80. That area is now pivotal resistance where failed rallies offer short entries with stops above. Support levels stand near 62.77 and 60.55, then a larger congestion shelf close to 55.00. The fundamental bear case is a higher probability of staged sanctions relief on Russian crude weighted against a still contained Middle East risk.
VII. The Week Ahead
1) Macro calendar
CPI on Tuesday August 12 at 8:30 AM Eastern. Consensus looks for headline month over month at 0.2 percent and core at 0.3 percent. PPI on Thursday August 14 at 8:30 AM with both headline and core near 0.2 percent month over month. Retail Sales Friday August 15 at 8:30 AM with consensus near 0.5 percent month over month. Secondary reports include NFIB small business sentiment Tuesday, weekly jobless claims Thursday, Empire State manufacturing Friday, and University of Michigan consumer sentiment Friday.
2) Why CPI and PPI matter now
These are the first clean reads after the July FOMC and after the first wave of new tariffs. Goods components that are sensitive to import costs should start to show the early pass through. Categories like household furnishings and electronics are the ones to watch. If core overshoots, the equity market’s duration trade is at risk. If it matches or misses, the bond rally extends and the index leadership likely stays with tech.
3) Micro calendar and corporate color
Earnings season continues but the heaviest reports are past. Guidance from semis, hardware OEMs, and global industrials will be watched for comments on inventory, lead times, and rerouting plans in case of a China snapback. Logistics firms may also comment on bookings and capacity asks tied to tariff uncertainty. Energy companies will speak to capex flexibility into a lower price deck and to views on potential Russia volumes if sanctions ease.
VIII. Strategy Playbook AND WEEKLY LEVELS
Subscribers are urged to use the tradingview indicator to plot the levels.
NOTE: SUBSCRIBERS ARE URGED TO JOIN THE DISCORD AT THEIR EARLIEST CONVENIENCE.
https://sidestack.io/algoflows
Sign in with your Substack email and click the link in your email and you are in.
1) Equities
ES: Buy into the
