
Weekly Market Outlook 11/02/2025
Cut's done, what's next.

Hello traders,
Hope you had a great weekend.
Our trade idea of long ZEC(Zcash) is now up nearly 200% since entry with minimal drawdown.
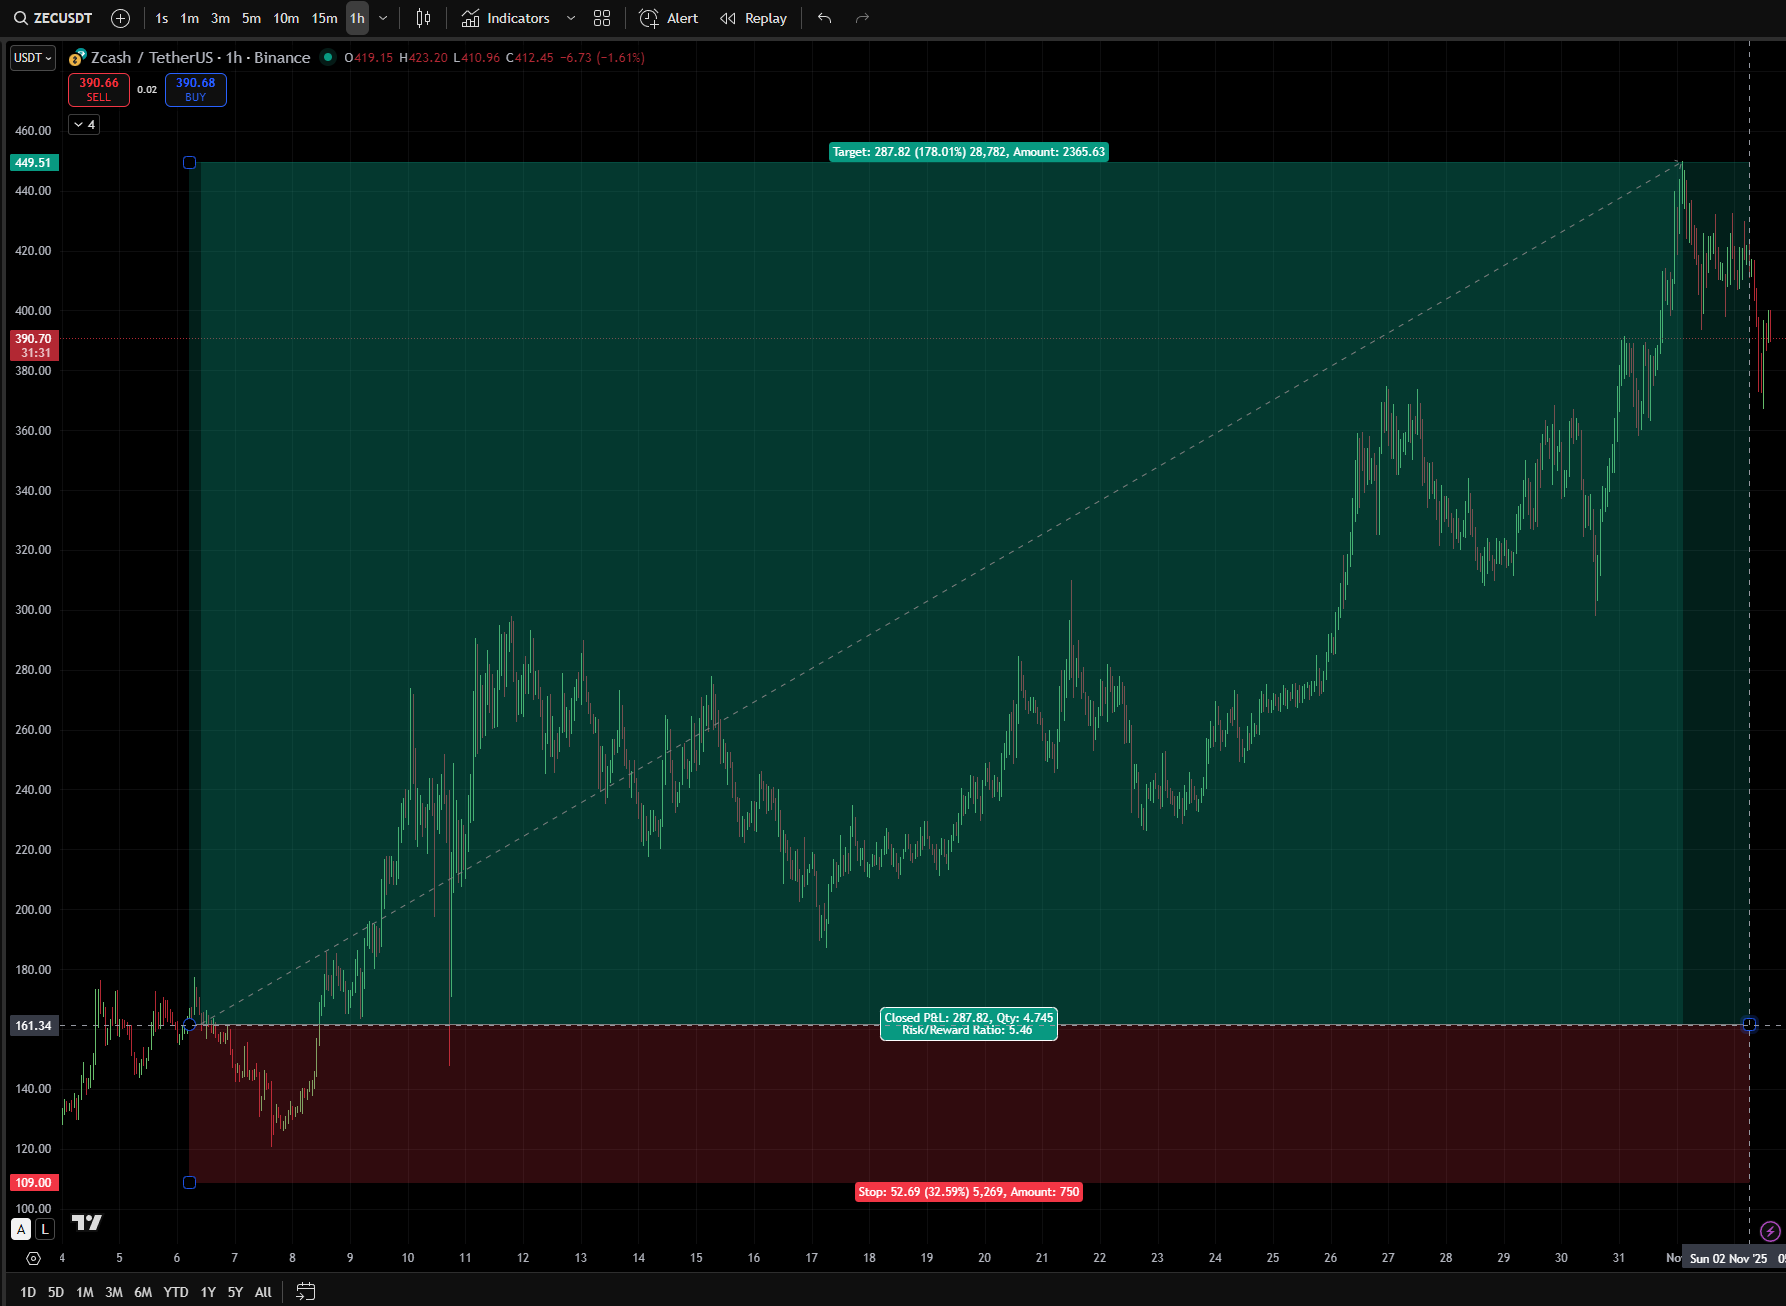


when you are right you don’t really need to write 80 page essays.
Realtime Discord access with equity positions tracker, intraday orderflow & option dealer summaries included with the paid newsletter membership . Click here to subscribe.
THE “HAWKISH” CUT
The October 29 FOMC meeting was a masterclass in strategic ambiguity and a pivotal communication event. With its usual economic data unavailable because of the prolonged U.S. government shutdown, the Federal Reserve delivered what many called a “hawkish cut.” It implemented the widely expected 25 basis point reduction while using forward guidance to reset market expectations for the path of policy, especially for the December meeting. This was a deliberate and preemptive effort to reassert control over the inflation narrative and preserve policy flexibility in an environment of extreme uncertainty.
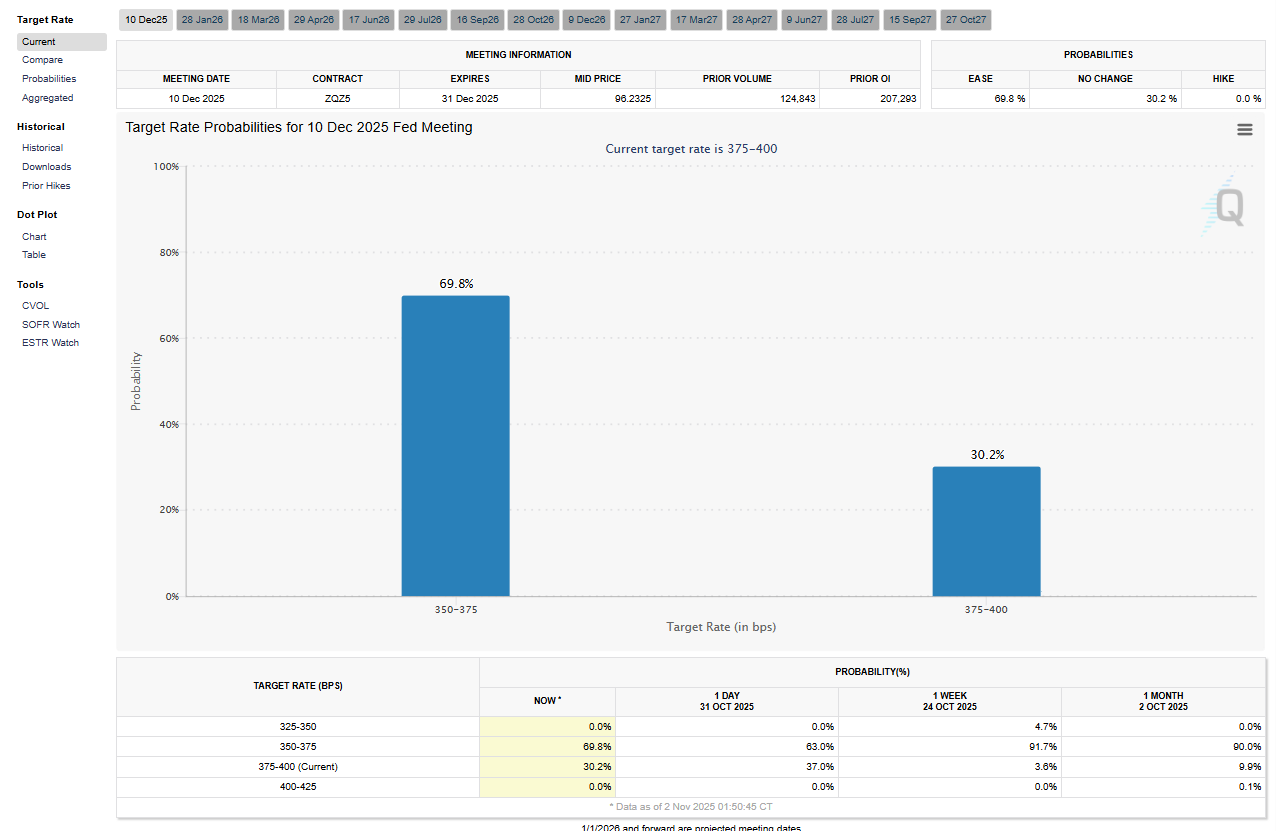
The committee lowered the target range for the federal funds rate to 3.75% to 4.00% and announced the end of its balance sheet reduction program, or Quantitative Tightening, effective December 1. Although the move was an easing step, Chair Powell’s message was not accommodative. He said a December rate cut was “far from a foregone conclusion,” a line that quickly moved global markets. Powell described the October cut as a risk-management decision intended to guard against downside risks to employment, which he said “appear to have risen in recent months.” This framing departed from the market’s prevailing view of a sustained easing cycle.
Markets reacted quickly. The implied probability of a December cut in CME FedWatch futures fell from more than 85% before the meeting to about 69%(NICE!) afterward. This repricing suggests the Fed’s communication strategy succeeded. The central bank is navigating a difficult path. The ongoing shutdown, estimated to trim 0.1 percentage points from GDP for each week it continues, has delayed key inflation and employment reports. Powell acknowledged the challenge and noted that policymakers would rely on alternative data sources, while recognizing the situation is not ideal.
The policy choice reflects a deeper strategic calculation. Hawkish guidance issued in a data vacuum acts as a preemptive defense against a loss of credibility. By signaling a tougher stance now, the committee anchors inflation expectations and keeps maximum flexibility for later decisions. If subsequently released data show an economy that is running hot, the Fed is already positioned for that outcome. If the data reveal meaningful weakness, the committee can pivot to a more dovish stance and present it as a prudent response to evolving conditions rather than a mistake.
The decision to end QT also deserves attention. It functions as a form of “stealth easing” that partly offsets the hawkish tone of the guidance. Stopping balance sheet runoff offers a subtle liquidity backstop for the banking system and the Treasury market. By halting the steady withdrawal of liquidity from market plumbing the Fed is easing financial conditions at the margin even as it guides the policy rate in a more restrictive direction. This two pronged approach uses tough talk on the headline rate to manage inflation psychology while quietly stabilizing market liquidity, an attempt to navigate an environment with no risk free options.
Bull Case for Chinese Stocks: A Trade Deal Catalyst
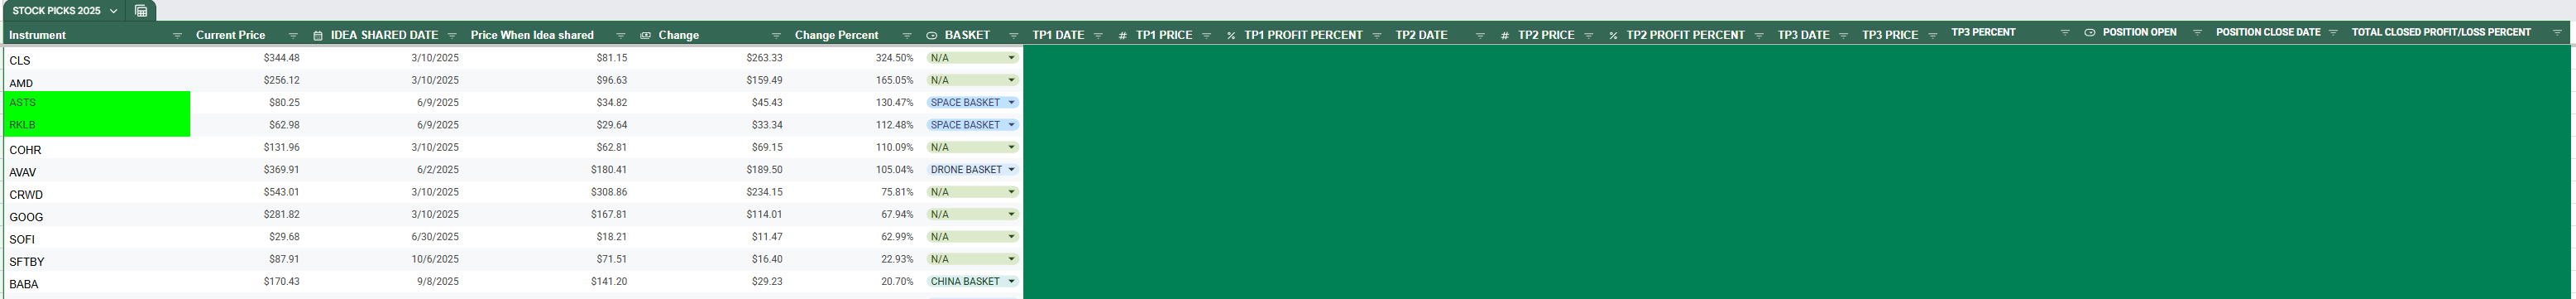
Equity picks end of the month update has been shared with paid subscribers. Please check the appropriate channel in the discord with the sheets access.
China basket updates would be send by Wednesday EOD.
Chinese equities look set for a strong rally after the breakthrough U.S.–China trade truce reached on 30 Oct 2025 in Busan. The White House called the agreement the “biggest de-escalation yet,” and it removes the most acute near-term risks that have capped valuations and kept global funds underweight the world’s second-largest equity market.
Tariff Relief = Immediate Earnings Upgrade
Effective 10 Nov, the U.S. will cut the average tariff rate on Chinese goods from 57% to 47%, and it will scrap the threatened 100% levy that was due to take effect 1 Nov.
Every 10 percentage-point reduction in tariffs adds roughly 1.8% to 2.1% to the net-income margin of China’s export-heavy sectors (electronics, machinery, furniture). With 42% of CSI-300 revenue coming from overseas, consensus 2026 EPS can rise 5% to 7% even without macro help.Tech and Rare-Earth Geopolitical Premium Unwinds
China agreed to a one-year pause on export controls for rare-earth magnets, gallium, germanium, and graphite, while the U.S. will resume shipments of high-grade AI chips.
Semiconductor, EV supply chain, and renewable-energy names that had priced in a 20% to 30% revenue haircut from dual-use restrictions now face upside surprise risk. Nvidia, AMD, and ASML rose 3% to 7% on the headline; their Chinese counterparts (SMIC, Hua Hong Semi, CATL), which trade at 40% discounts to 18-month highs despite similar fundamentals, could follow.Agriculture Purchase Guarantees FX Stability
Beijing committed to buy 12 mmt of soybeans by year-end and 25 mmt annually through 2028, the first hard-floor purchase schedule since 2017.
More stable FX expectations (USDCNH already down 1.2% after the deal) lower the cost of capital for mainland corporates and reduce the probability of another yuan devaluation reminiscent of 2015 to 2016.Policy Put Returns
With external risk reduced, Beijing can pivot from defensive light stimulus to pro-cyclical easing: RRR cuts, LPR reductions, and faster local-government bond issuance are already being hinted for Q4.
Historically, every 50 bp RRR cut has translated into roughly 3% CSI-300 outperformance over the following 90 days.Valuation and Positioning: Still the Cheapest Risk-On Beta
CSI-300: 11.1× 12-month forward EPS versus 20× for the S&P 500
Hang Seng China Enterprises: 8.3×, about 1.3 standard deviations below the 10-year mean
Active global funds are roughly 380 bp underweight China versus MSCI ACWI, the widest gap since 2016
Even a partial rerating to 13× (still a 30% discount to EM ex-China) implies more than 20% index upside.
Flows: Southbound, Northbound, and Passive
Hong Kong Connect daily net buys hit a seven-month high on Monday.
FTSE Russell confirmed it will restore China A-shares to a 25% inclusion factor in its 2026 review, which should force about USD 18 billion of passive inflows.
CNY strength reduces hedging costs for foreign holders, removing a key technical barrier.
Bottom Line
The trade truce turns the “un-investable” narrative into a story of positive earnings revisions, multiple expansion, and stronger flows. In the 12 months after prior major tariff pauses (Jan 2020 and Apr 2022), Chinese equities rallied 28% and 31%. With lower starting multiples and higher policy beta today, a 30% to 35% move in H-shares and A-shares through 2026 looks like a base case rather than a stretch. Consider buying the CSI-300, Hang Seng Tech, and onshore semiconductor ETFs on any pullback of less than 3%.
Take advantage of APEX’s 70% promo code and pass account in one day. Also Use code ALGO or alternatively just click the button below
I’m also giving away any size Apex accounts for free for 3 random people who like and restack this post . Contest ends this Friday.
The Bond Market’s Verdict: Yields Reassert Dominance
The U.S. Treasury market delivered a swift and decisive verdict on the Federal Reserve’s policy pivot. Yields, particularly on the short end of the curve which is most sensitive to monetary policy expectations, surged as traders rapidly repriced the future path of the federal funds rate. This move in the bond market stands in stark contrast to the equity market’s ebullience and represents a significant headwind for risk asset valuations.
Following Chairman Powell’s press conference, the 10-Year Treasury yield (/TNX) decisively pushed back above the psychologically and technically significant 4.0% level, ultimately closing the week around 4.08%. The 2-Year Treasury yield, a more direct reflection of the market’s short-term rate expectations, experienced an even sharper move, rising to 3.6%. This upward shift in the entire yield curve reflects a market that is now taking the Fed’s hawkish rhetoric seriously, pushing back the timeline for a sustained easing cycle and pricing in a higher “terminal rate.”
Recent Treasury auctions conducted last week indicated solid, though not overwhelming, demand for U.S. government debt. The auction of 7-Year Notes on October 28th cleared at a high yield of 3.790%, while the 2-Year Note auction on October 29th settled at 3.504%. These results suggest that while there is an appetite for duration, investors are demanding higher compensation for the increased uncertainty surrounding Fed policy.
The implications of this bond market repricing are profound. The valuation of risk assets, particularly equities, is fundamentally linked to the “risk-free” rate provided by Treasury yields. In discounted cash flow models, a higher risk-free rate increases the discount rate applied to future corporate earnings, thereby reducing their present value. The surge in the 10-year yield above 4.0% should, all else being equal, exert significant downward pressure on equity valuations. The fact that the S&P 500 and Nasdaq-100 managed to post new highs in the face of this headwind is a testament to the extreme concentration of the rally in a handful of mega-cap technology stocks, which are perceived by some market participants as being insulated from the effects of higher interest rates. This divergence is unsustainable. The bond market is functioning as the more rational arbiter of macroeconomic reality, and its message is clear: the cost of capital is rising. The equity market’s defiance of this fundamental reality is a symptom of its narrow leadership and represents a critical vulnerability. A sustained move in the 10-year yield above the 4.25% level could prove to be the catalyst that finally breaks the equity market’s narrow advance.
S&P 500 (ES): Strength in “small “ numbers
The S&P 500’s ascent to new all-time highs is a textbook example of a non-confirming, and therefore suspect, technical advance. While the price action on the surface appears robust, an examination of the market’s internal dynamics reveals a rally built on a dangerously narrow foundation. The index is vulnerable to a sharp reversal as the underlying participation, or market breadth, continues to decay.
